


Islamic banking entered 2026 with greater scale but also a more demanding test of what banks do with it. The Islamic Financial Services Board reported global Islamic banking assets of $3.051 trillion in 2025, with the industry remaining concentrated in its largest Gulf and Asian markets.
TAB Global’s 2026 Largest Islamic Banks ranking reflects that concentration. Al Rajhi Bank remained the world’s largest Islamic bank with $278.2 billion in assets, followed by Kuwait Finance House with $139 billion and Dubai Islamic Bank with $113.2 billion. Maybank Islamic ranked fourth with $84.2 billion, followed by Alinma Bank at $82.9 billion and Abu Dhabi Islamic Bank at $76.4 billion.
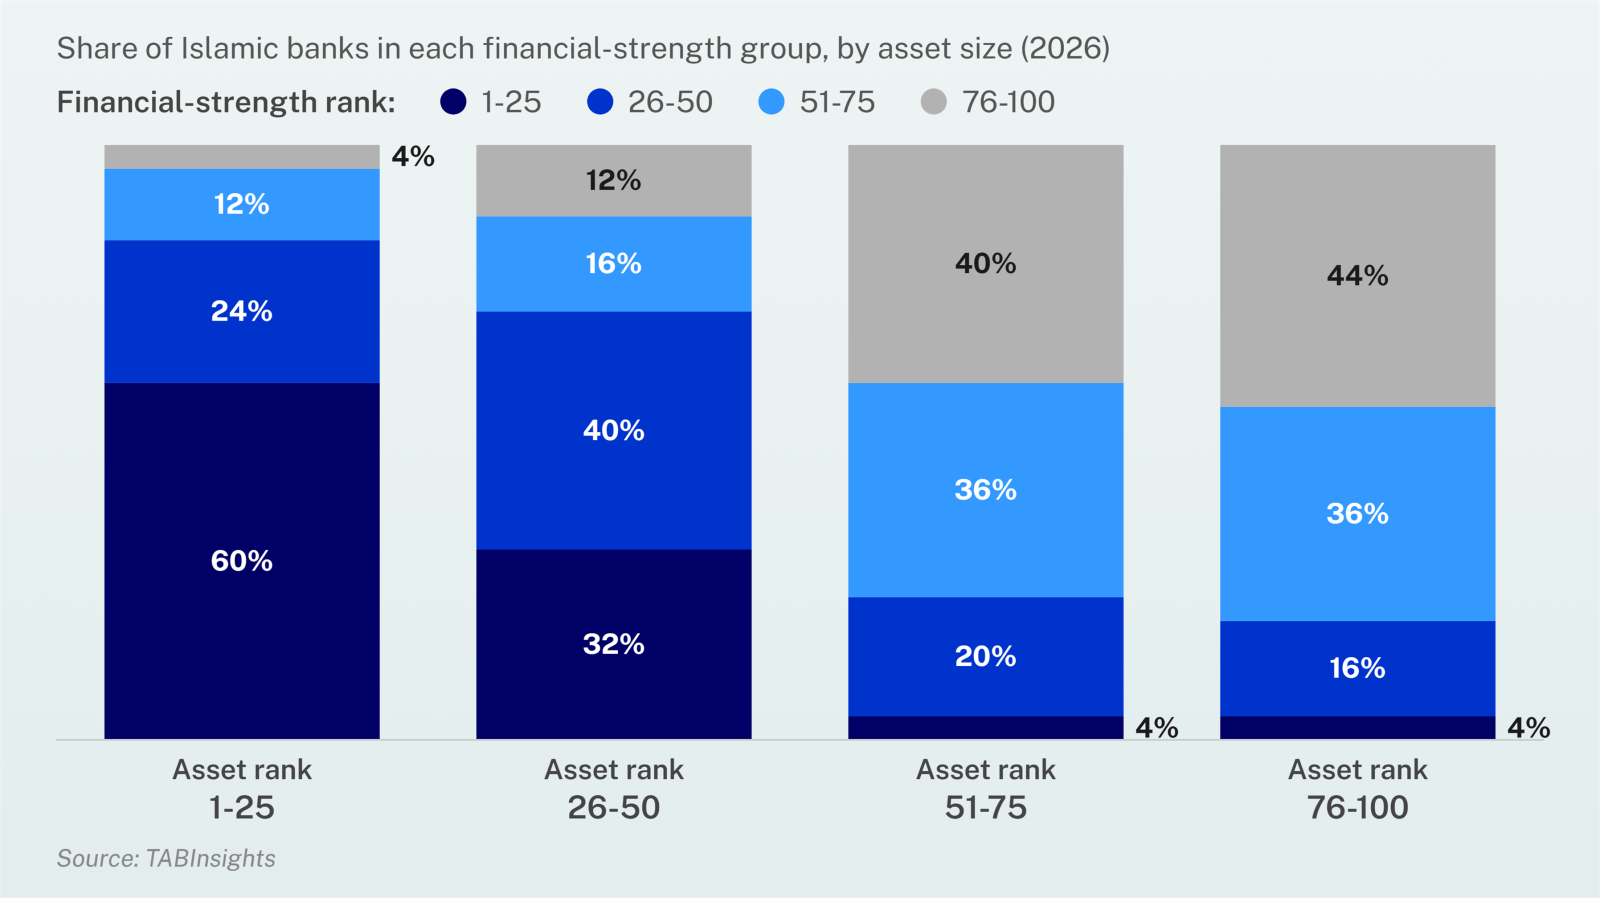
Scale clearly matters: 84% of the 25 largest Islamic banks ranked in the top half of the 100 institutions assessed in TAB Global’s Strongest Islamic Banks ranking. But the exceptions show that accumulating assets is very different from turning them into financial strength.
The relationship between the two rankings therefore raises a more useful question for banks than who is biggest or strongest: what does it take to turn scale and growth into sustainable financial strength?
Scale helps, but does not guarantee strength
Al Rajhi Bank demonstrates what happens when scale and strength come together. The Saudi institution ranked first both by assets and overall financial strength in 2026. Kuwait Finance House was second largest and third strongest, while Dubai Islamic Bank was third largest and tenth strongest. Alinma Bank ranked fifth by size and sixth by strength.
Across the population, 60% of the 25 largest Islamic banks also ranked among the 25 strongest. Another 24% were in the next group, meaning 84% of the 25 largest institutions occupied the upper half of the strength ranking.
The pattern reverses among smaller institutions. Only 4% of banks ranked 76th to 100th by assets reached the top 25 for strength, while 80% were in the lower half.
Scale therefore provides advantages but is better understood as an enabler than an outcome. Larger banks can spread technology and operating investment over broader franchises, diversify earnings and funding, and absorb the cost of regulatory and risk infrastructure. The advantage matters when management converts it into better operating economics.
This helps explain the strong showing of banks in the largest Gulf markets. S&P Global Ratings said larger domestic economies and faster growth had supported bank profitability in Saudi Arabia and the United Arab Emirates, resulting in better operating efficiency than elsewhere in the region.
The lesson for smaller banks is therefore not simply to become bigger. It is to reproduce as many of the economic benefits of scale as possible through specialisation, technology, funding discipline and operating leverage.
Stronger banks make the economics of scale work
The financial profiles of the four strength groups show how differently banks are converting their balance sheets into earnings and resilience.
The 25 strongest banks generated a median return on assets (ROA) of 1.87%, compared with 1.10% for banks ranked 26th to 50th, 0.80% for the next 25 and just 0.32% among the bottom 25.
Efficiency shows an even sharper divide. The median cost-to-income ratio was 35% among the strongest 25 banks. It rose to 47.5% among the next group, 53.5% among banks ranked 51st to 75thand 72.2% among the bottom 25.
Median gross non-performing financing (NPF) was 1.70% among the strongest banks and 1.85% in the next group, before rising to 4.73% and 5.03% respectively in the lower half.
The difference in NPF reserve coverage was larger still. It stood at a median 151.3% among the strongest banks, falling successively to 102.8%, 73.1% and 44.8% across the remaining groups.
These measures form part of TAB Global’s strength assessment, so the fact that stronger-ranked banks perform better on them is not itself a discovery. What matters is the scale of the differences and what happens when they are considered alongside size and growth.
Capital adequacy provides a useful contrast. Median capital adequacy ratios were much closer across the four groups: 20.2% among the top 25, 19.2% among banks ranked 26th to 50th, 18.1% in the next group and 19.6% among the bottom 25.
Capital remains essential to resilience. But within this population, simply holding more capital does not distinguish the strongest banks nearly as clearly as their ability to generate earnings, control costs and manage the quality of their financing portfolios.
The more useful management question is therefore not only how much balance-sheet capacity a bank has, but what it produces from it.
Maximum growth is not the same as quality growth
Growth provides a more useful comparison because financing growth carries only a small weight in the scorecard, and the results show that faster expansion does not translate mechanically into greater overall strength.
Dividing the 100 banks into four equal groups according to inflation-adjusted financing growth shows that the fastest-growing institutions were not the strongest group.
The weakest-growing 25 banks, with median inflation-adjusted financing growth of -0.7%, had a median strength ranking of 65. The next two groups, with median growth of 7.4% and 13%, ranked substantially better at 37th and 35th respectively.
But the fastest-growing group, with median inflation-adjusted financing growth of 25.6%, had a median strength ranking of 52.5, below the intermediate-growth groups.
This does not mean rapid growth makes a bank weaker. It means that growth becomes valuable when the rest of the franchise can support it.
Albaraka Türk Kat?l?m Bankas? illustrates the distinction. The bank recorded credit growth of 59.5% in 2025, while its NPF ratio was 1.7% and its special provisioning ratio was 80.7%. But headline profitability also benefited substantially from a reversal of free provisions. Return on average equity was 29.9% excluding that effect and 63.9% including it.
The example demonstrates why rapid expansion has to be assessed alongside the quality of earnings and the buffers supporting it, rather than through headline growth alone.
Other banks strengthened without exceptional balance-sheet expansion. HSBC Amanah Malaysia ranked substantially higher in 2026 despite a contraction in financing, while OCBC Al-Amin Bank combined more moderate financing growth with stronger profitability, efficiency and asset-quality measures.
A bank can therefore strengthen by extracting more value and resilience from the franchise it already has rather than relying on balance-sheet expansion.
Funding provides another constraint on how fast banks can sustainably grow. In Saudi Arabia, credit growth had outpaced deposit growth in recent years as banks helped finance the kingdom›s investment programme, putting pressure on sector liquidity. Banks in Saudi Arabia and the UAE subsequently offered higher savings rates to attract deposits, while Saudi banks were expected to moderate lending growth to rebalance their books.
For Islamic banks, the practical question is therefore not how quickly financing can grow, but whether funding, earnings, capital and risk-management capacity can grow with it.
Smaller banks can outperform their scale
Some of the most instructive institutions are those that break the relationship between size and strength.
Bank Aladin Syariah ranked only 91st by assets but 18th in financial strength, a difference of 73 positions. Amãna Bank ranked 95th by size but 48th for strength, while Bank Mega Syariah was 85th largest but 39th strongest.
ABC Islamic Bank ranked 61st by assets but 24th strongest, while Türkiye Emlak Kat?l?m Bankas? was 37th largest but fourth strongest.
These institutions show that the advantages associated with scale are not exclusive to the largest banks.
The reverse is equally instructive. Islami Bank Bangladesh ranked 25th by assets but 99th for strength. Masraf Al Rayan (Qatar) was eighth largest but 71st strongest, MBSB Bank ranked 33rd by assets and 84th by strength, while RHB Islamic Bank was 17th largest but 58th strongest.
The overall population demonstrates that size matters. The exceptions show why size alone is not enough.
For smaller institutions, specialisation, disciplined costs and risk management can partly compensate for the absence of scale. For larger institutions, size creates an advantage only when the organisation converts it into operating leverage, earnings and resilience.
Efficiency and earnings distinguish the banks gaining ground
Year-on-year movements provide another perspective, although they are not a pure measure of operating improvement.
The 2026 Strongest Islamic Banks scorecard introduced sovereign rating as a seventh criterion with a 5% weighting and rebalanced the existing criteria. Relative positions are also affected by changes elsewhere in the population. Ranking movements therefore cannot be attributed solely to changes in a bank’s financial performance.
With that qualification, a clear difference emerges between the banks making the largest gains and those suffering the largest ranking declines.
Banks rising by more than ten positions recorded a median 0.16 percentage-point improvement in ROA and a 2.57 percentage-point reduction in their cost-to-income ratios. Their operating profit grew by a median 16.5%.
Banks falling by more than ten positions showed the opposite pattern. Median ROA declined 0.35 percentage points, cost-to-income deteriorated by 6.72 percentage points and operating profit fell 22.1%.
Banks remaining within five places of their previous ranking sat between those extremes. Median ROA was broadly unchanged, cost-to-income improved by 0.41 percentage points and operating profit grew 10.3%.
Asset quality did not separate the groups nearly as neatly. Banks falling by more than ten places actually recorded a small median improvement in NPF and a slight increase in NPF reserve coverage.
That distinction matters. The year-on-year analysis suggests that profitability and efficiency were more consistent characteristics of the banks gaining or losing substantial ground than changes in asset quality.
Individual institutions illustrate the pattern without making it universal. Standard Chartered Saadiq rose 30 positions alongside stronger ROA, a substantially lower cost-to-income ratio and strong operating-profit growth. OCBC Al-Amin Bank rose 22 positions alongside improved profitability and efficiency.
Among the fallers, BankIslami Pakistan dropped 28 places as ROA declined and its cost-to-income ratio increased sharply, despite an improvement in NPF. Bank NTB Syariah fell 31 places as profitability and efficiency weakened and asset quality also deteriorated.
The year-on-year comparison therefore reinforces the importance of operating leverage: growth in the balance sheet matters less if profitability and efficiency are moving in the opposite direction.
Strong buffers matter before conditions deteriorate
The interaction between earnings, funding and risk capacity becomes more important when operating conditions turn.
Low NPF ratios describe the current condition of the financing book. NPF reserve coverage shows how much protection banks have built against problem financing already recognised. Earnings, liquidity and capital provide further capacity when conditions deteriorate.
GCC banks entered 2026 with relatively strong buffers. Their average NPL ratio remained broadly stable at 2.6% at the end of March 2026, although more than half of the region’s 50 largest banks had increased their cost of risk. S&P expected average cost of risk to rise about 20 basis points during 2026.
Capital and liquidity also remained substantial. The average Tier 1 capital ratio among the 50 largest GCC banks was about 17% at the end of March, while liquid assets represented about 20% of their balance sheets. Domestic deposit growth also outpaced credit growth in the first quarter.
The practical lesson extends beyond the Gulf. Resilience is built before it is needed.
Banks that use favourable conditions to strengthen earnings capacity, funding, NPF reserve coverage, liquidity and capital have more room to continue supporting customers when conditions deteriorate. Those that consume their buffers to maximise short-term growth have less room when the cycle turns.
Turning scale into sustainable strength
Islamic banking is no longer short of growth. The more important management question is what kind of growth banks produce and whether it improves the economics and resilience of the franchise.
The 2026 Largest and Strongest Islamic Banks rankings point to several priorities.
Banks need to make efficiency a source of competitive capacity rather than treat it solely as an expense-management programme. Technology investment, process redesign and scale should ultimately allow income to grow faster than the resources required to generate it.
They also need to judge financing growth by the earnings and risk-adjusted value it creates. The fastest-growing group did not have the strongest median strength rank. Growth becomes valuable when funding, earnings, capital and risk-management capacity keep pace.
Asset-quality management cannot begin when problem financing appears. The large differences in NPF reserve coverage across the strength groups show how differently banks can enter a deterioration in credit conditions.
Finally, banks need to make scale pay. The largest institutions clearly possess an advantage: 84% of the 25 largest banks ranked in the stronger half of the population. But the exceptions in both directions demonstrate that size is neither sufficient nor indispensable.
Smaller banks can compensate through specialisation, efficiency and disciplined risk management. Large banks can squander their structural advantage when operating performance fails to keep pace with the balance sheet.
The next phase of competition in Islamic banking will therefore be less about who can add assets fastest than who can turn scale and growth into sustainable earnings, operating leverage and resilience.











 Google
 LinkedIn