


The world’s largest banks became larger again in the 2025 financial year (FY2025). The 1,000 institutions in TAB Global’s 2026 Largest Banks ranking held $180.7 trillion in combined assets, $91.8 trillion in net customer loans and $112.2 trillion in customer deposits, while generating $1.39 trillion in net profit.
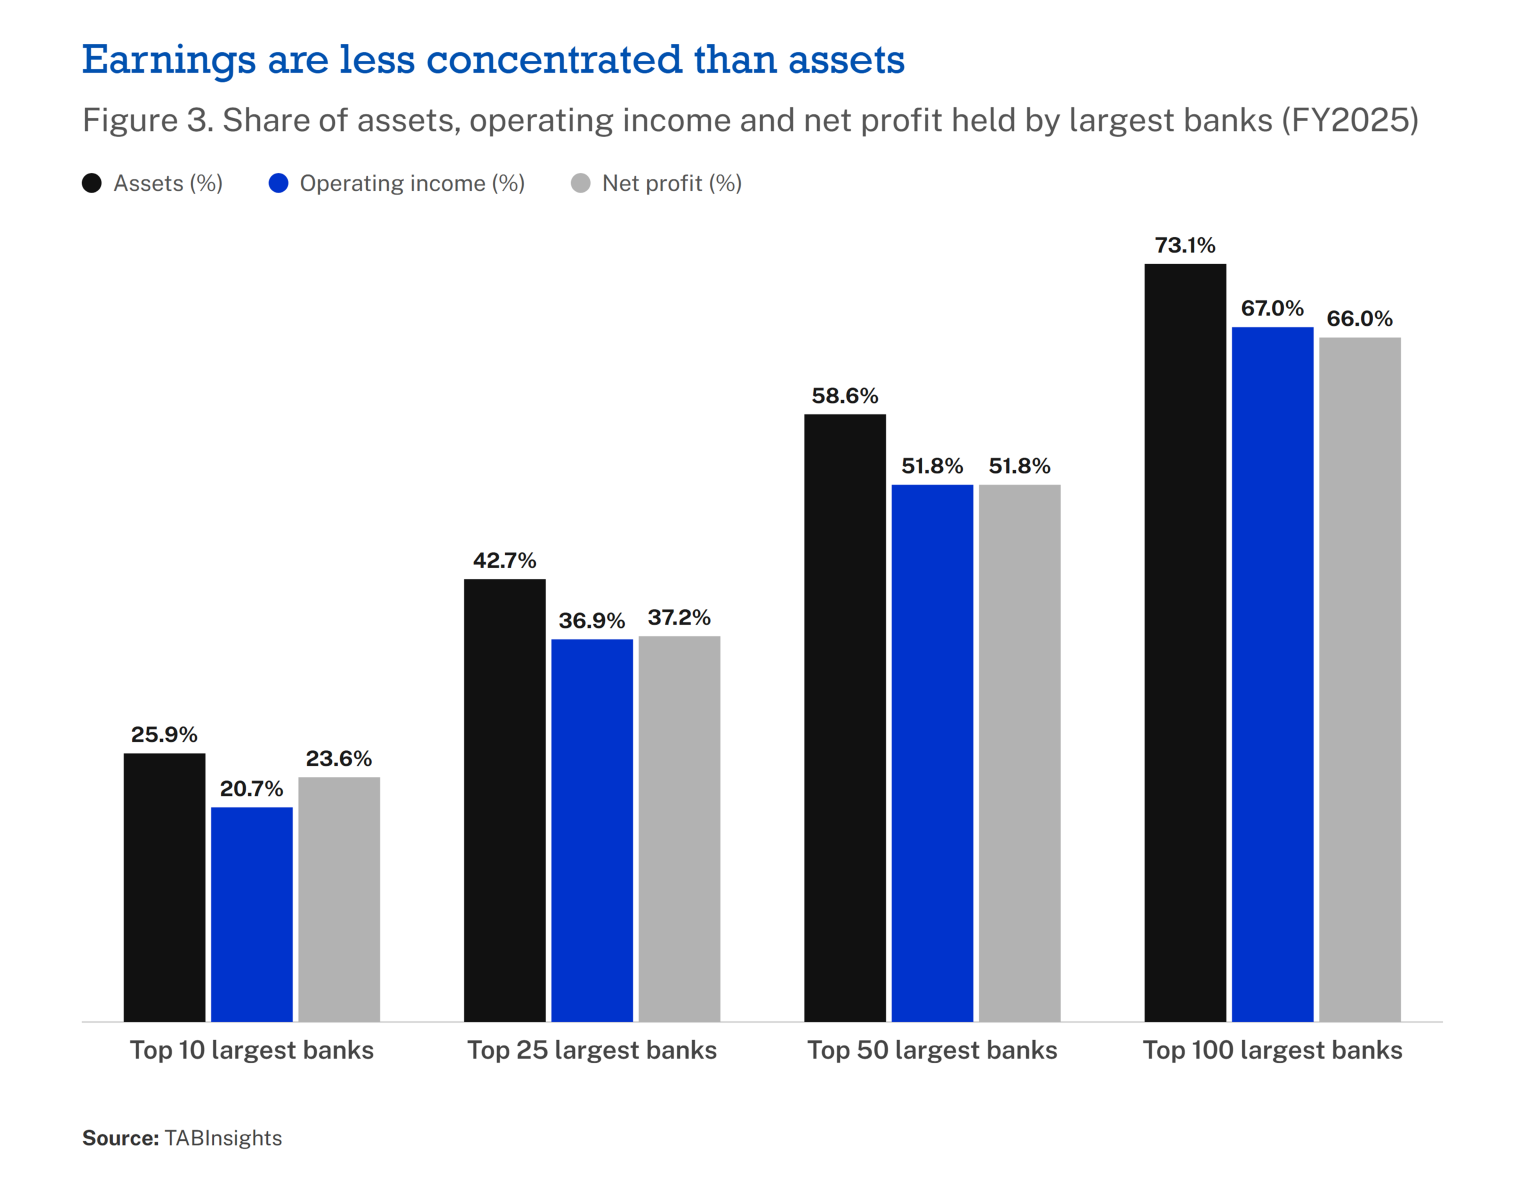
Scale remained heavily concentrated. The ten largest banks accounted for 25.9% of assets, the top 25 for 42.7%, the top 50 for 58.6% and the top 100 for 73.1%.
But cross-tabulating asset size against the underlying financial data shows that the financial characteristics associated with scale are not uniform.
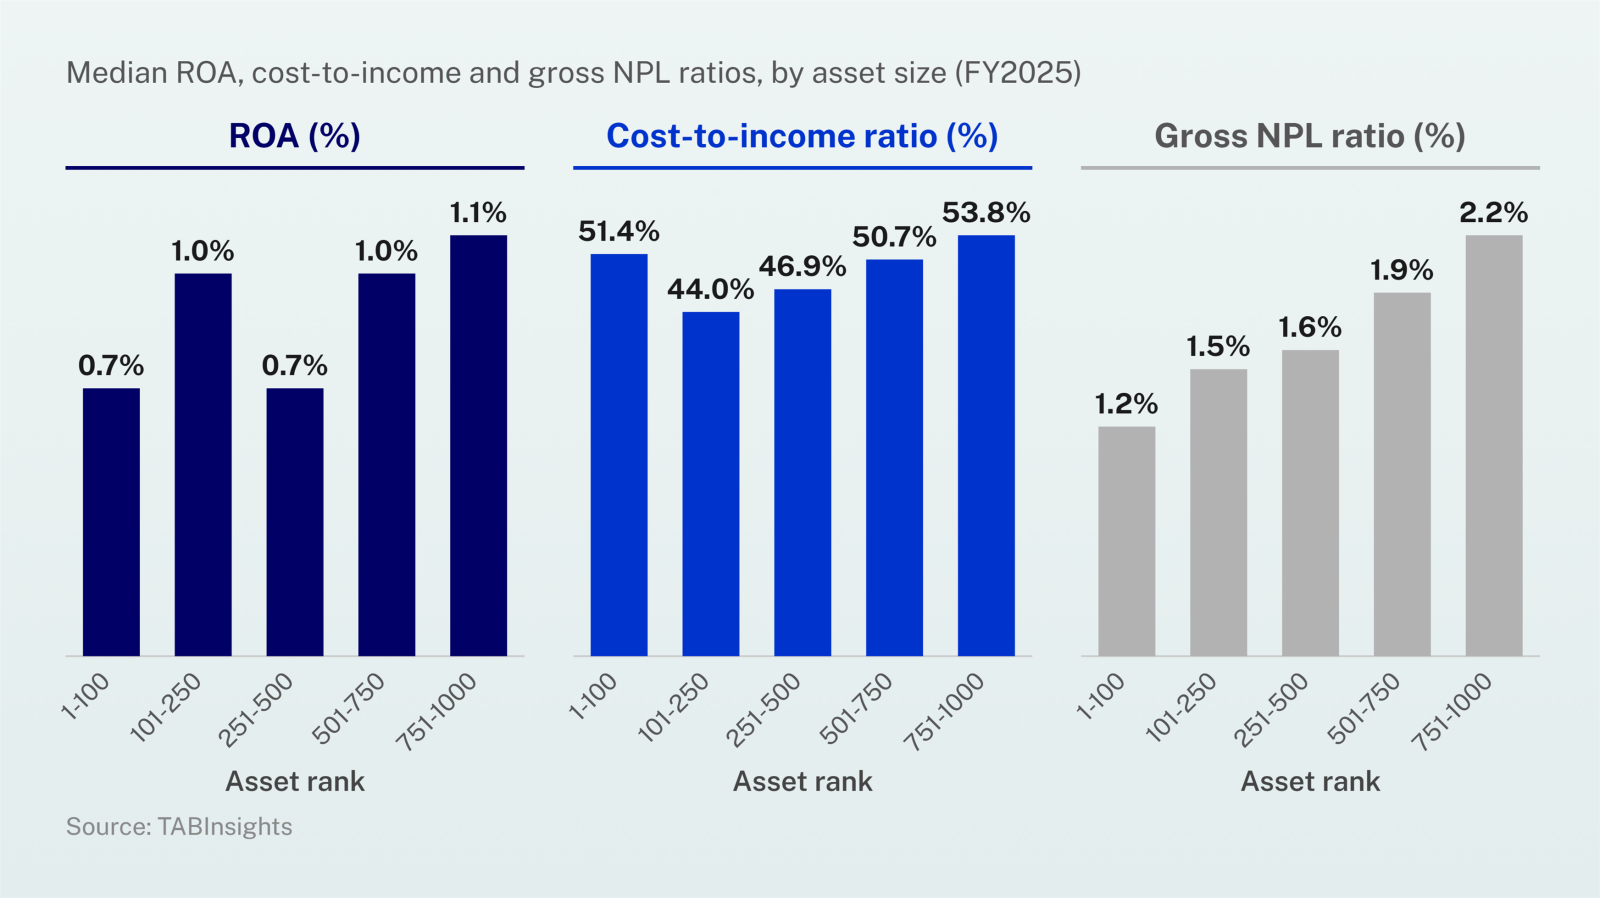
The 100 largest banks recorded lower median non-performing loan (NPL) ratios than every smaller size group, and NPL ratios increased progressively as bank size declined. Growth, profitability and efficiency did not follow the same pattern.
The largest 100 banks did not grow fastest, generate the highest return on assets (ROA) or record the lowest cost-to-income ratio. Banks ranked immediately below them were considerably more efficient, while the smallest 250 generated higher median ROA.
The more useful question is therefore not simply which banks are largest, but what scale actually delivers.
Global banking scale remains concentrated
Industrial and Commercial Bank of China (ICBC) remained the world’s largest bank, with $7.65 trillion in assets, followed by Agricultural Bank of China at $6.97 trillion, China Construction Bank at $6.52 trillion and Bank of China at $5.48 trillion.
Together, the four Chinese banks held $26.6 trillion, equivalent to 14.7% of the assets of all 1,000 ranked banks.
JPMorgan remained fifth with $4.42 trillion after its assets increased 10.5%, while Bank of America remained sixth.
The gap between the largest Chinese banks and their international peers nevertheless widened. ICBC’s assets were 72.8% larger than JPMorgan’s in FY2025, compared with 67.1% in FY2024 and 62.7% in FY2023.
China’s scale extended well beyond its four largest institutions. Its 151 ranked banks held $54.6 trillion, or 30.2% of total ranked assets.
The number of banks with more than $1 trillion in assets also increased from 38 to 42. Seventeen were in Asia Pacific, 15 in Europe and ten in North America.
But concentration establishes only how large these institutions have become. It does not show what they produce from that scale.
Scale is associated most consistently with better asset quality
Of the financial measures examined, asset quality displays the clearest relationship with size.
The 100 largest banks recorded a median gross NPL ratio of 1.22%. It increased to 1.47% among banks ranked 101st to 250th, 1.55% for ranks 251st to 500th, 1.90% for ranks 501st to 750th and 2.20% among the smallest 250.
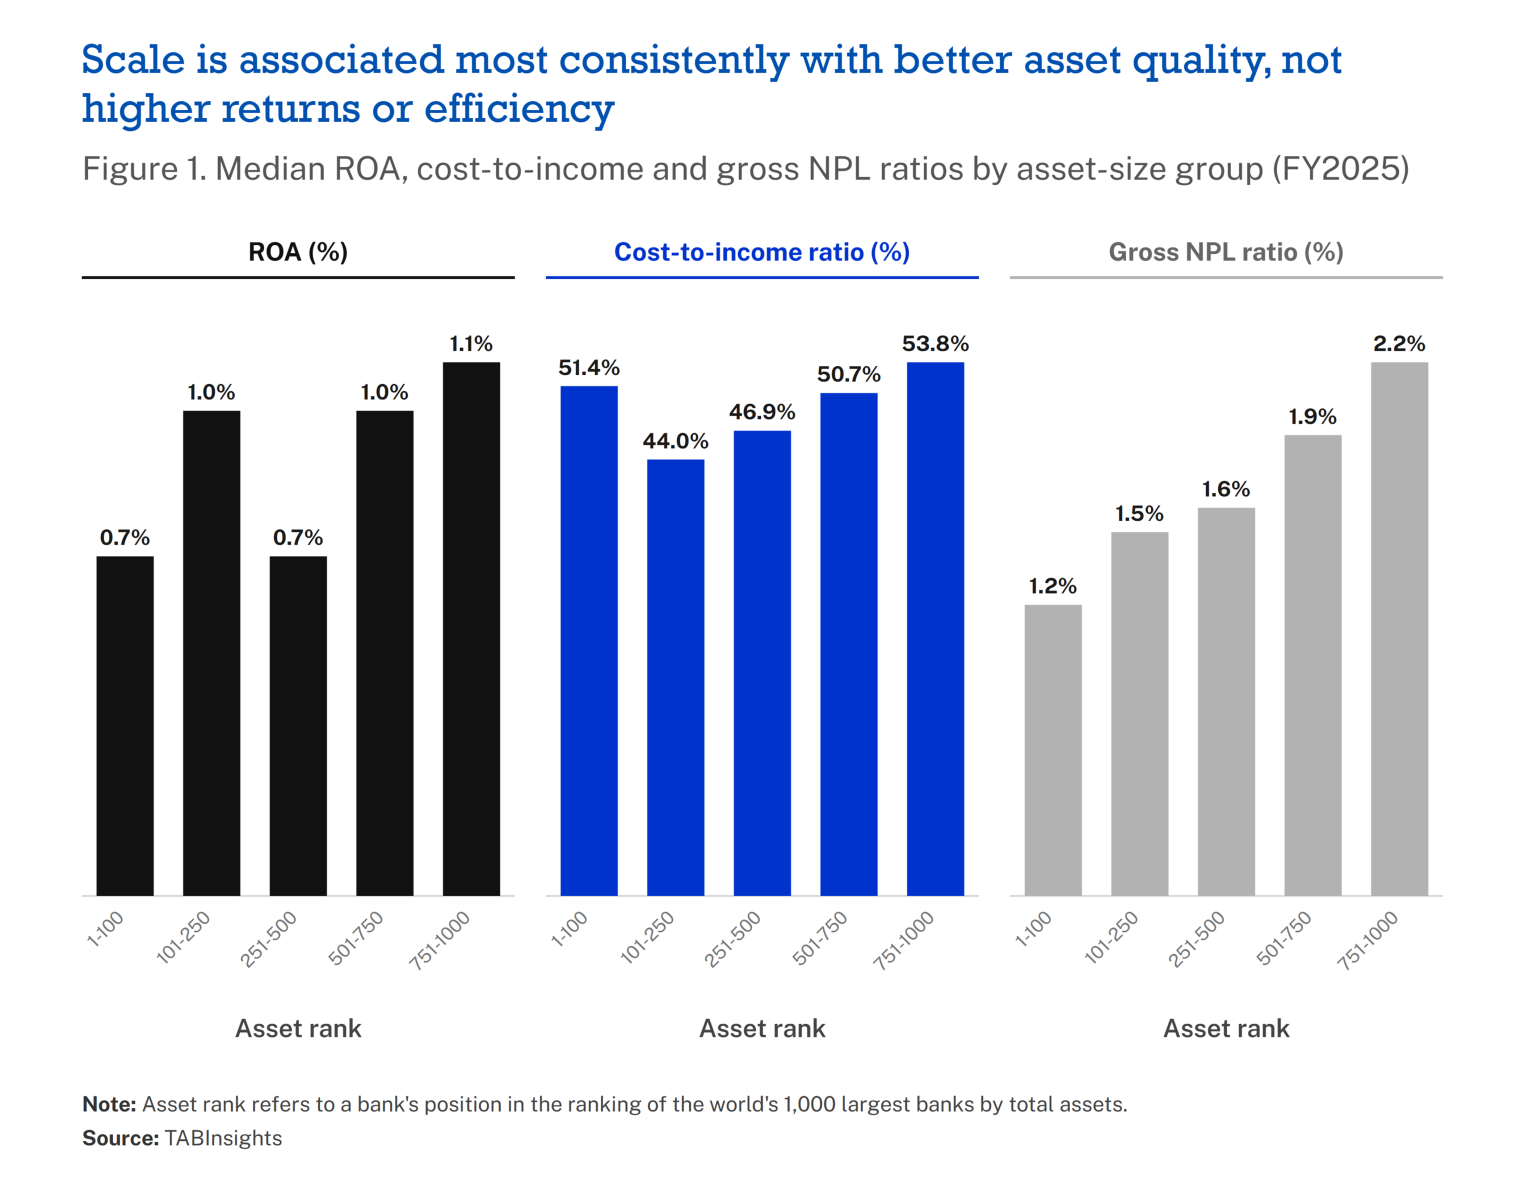
ROA does not follow the same progression. The largest 100 generated median ROA of 0.71%, compared with 0.97% among banks ranked 101st to 250th, 0.74% among ranks 251st to 500th, 0.95% among ranks 501st to 750th and 1.07% among the smallest 250.
Neither does operating efficiency.
The 100 largest banks recorded a median cost-to-income ratio of 51.4%. Banks ranked 101st to 250th performed considerably better at 44.0%. The ratio then increased to 46.9%, 50.7% and 53.8% across the remaining three groups.
The data therefore establish a clear association between greater scale and lower median NPL ratios in this population, but they do not establish why.
Bigger banks do not necessarily grow faster
Scale also does not determine the pace of balance-sheet expansion.
The 100 largest banks recorded median asset growth of 5.7% in FY2025. Banks ranked 101st to 250th grew 6.7%, those ranked 251st to 500th by 5.3%, banks ranked 501st to 750th by 6.7%, and the smallest 250 banks by 6.8%.
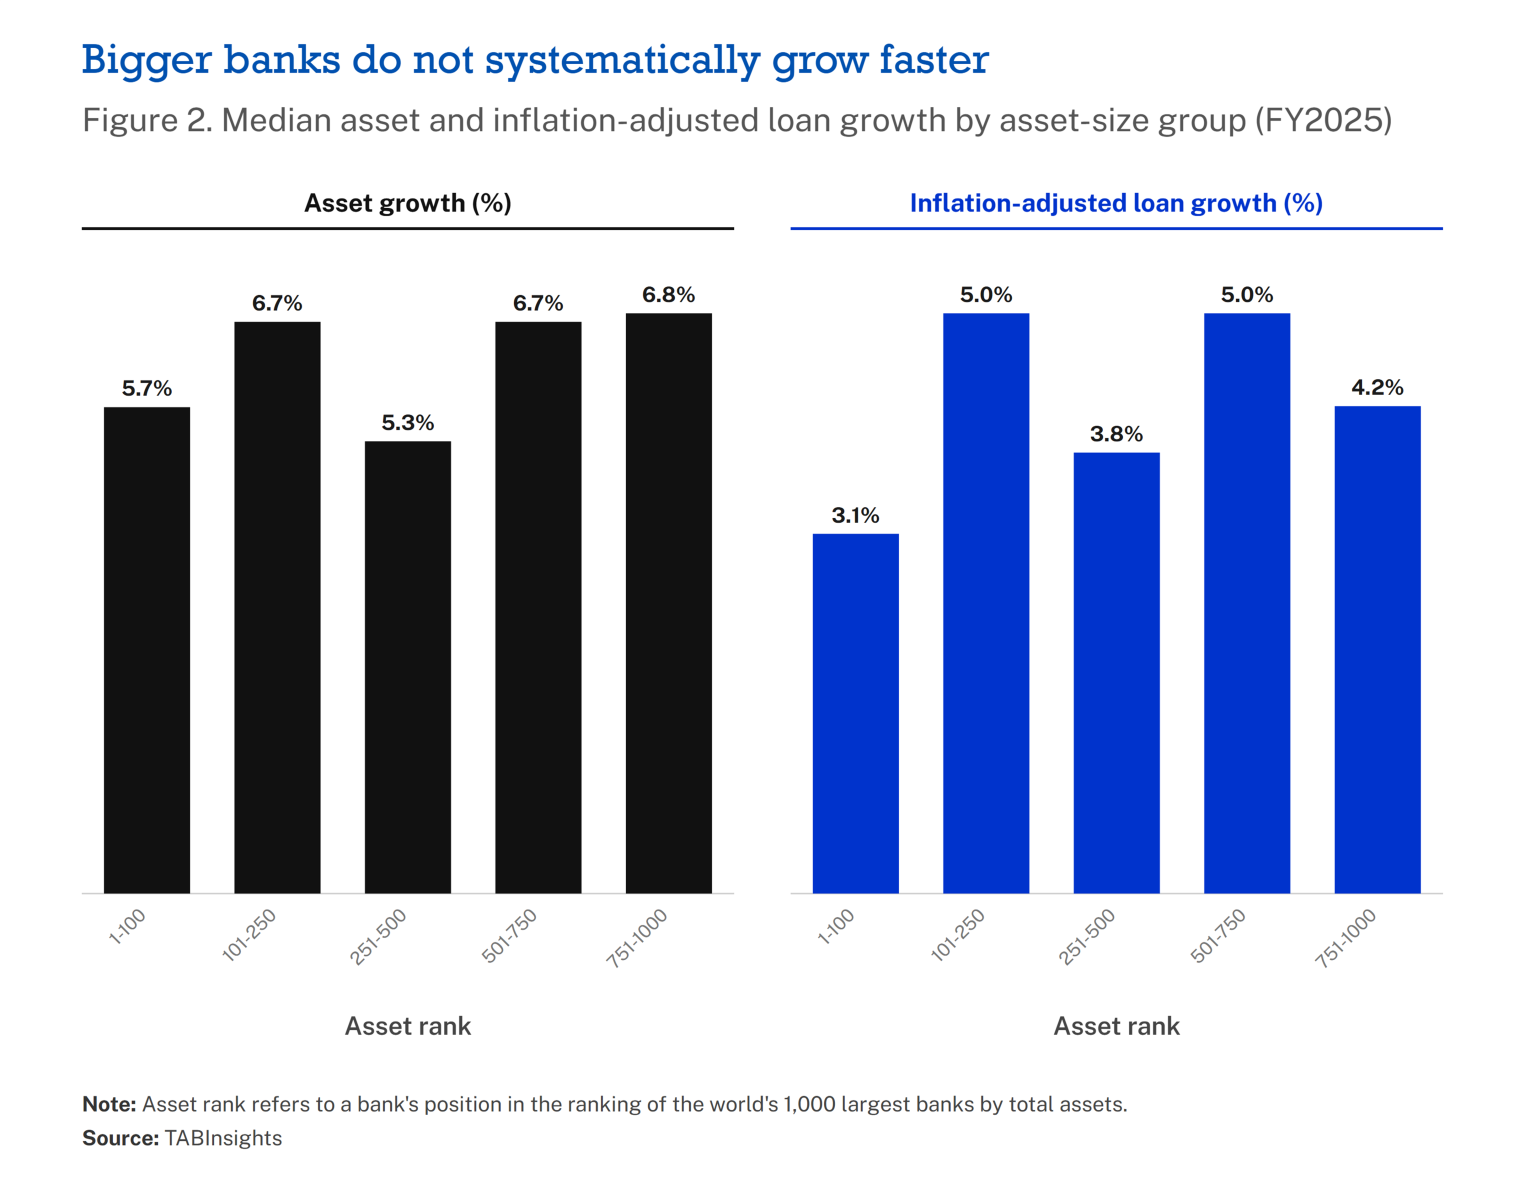
The pattern remains uneven when lending growth is adjusted for inflation.
Median inflation-adjusted loan growth was 3.1% among the 100 largest banks, compared with 5.0% among banks ranked 101st to 250th, 3.8% among those ranked 251st to 500th, 5.0% among banks ranked 501st to 750th and 4.2% among the smallest 250.
A large starting balance sheet can nevertheless produce enormous absolute expansion even when percentage growth is moderate.
The four Chinese megabanks demonstrate this. Agricultural Bank of China’s assets increased 12.8%, China Construction Bank 12.5%, ICBC 9.5% and Bank of China 9.4%, all from already exceptional asset bases.
Their expansion was also not simply a lending story. Asset growth at the four banks ranged from 9.4% to 12.8%, compared with loan growth of 7.5%–9.2% and deposit growth of 7.1%–8.2%, indicating broad-based balance-sheet expansion rather than growth concentrated in lending alone.
The largest US banks followed a different path. JPMorgan’s asset growth accelerated from 3.3% to 10.5%. Citigroup moved from a 2.4% contraction to 12.9% growth and Wells Fargo from a 0.1% contraction to 11.3%.
For the largest banks, even moderate percentage growth can therefore produce substantial absolute balance-sheet expansion, but size neither determines the percentage pace of growth nor how additional assets are deployed.
Earnings do not increase proportionately with scale
The disconnect between size and economic output becomes clearer when assets are compared with earnings.
The ten largest banks accounted for 25.9% of assets but 20.7% of operating income and 23.6% of net profit.
The top 25 held 42.7% of assets but generated 36.9% of operating income and 37.2% of net profit. Among the top 100, the respective shares were 73.1%, 67.0% and 66.0%.
The difference is also associated with a different balance-sheet mix.
Among non-Chinese banks in the top 100, loans represented 44% of assets, compared with 62% for banks ranked below 100, while securities represented 33% against 22%. Net interest income was correspondingly lower at 1.48% of average assets compared with 2.37%.
The largest banks also operated with less equity relative to assets. Equity accounted for 6.6% of assets among the top 100, compared with 9.4% among banks below the top 100, while ROE was 10.9% against 11.2%. The smaller equity base therefore narrowed the difference in shareholder returns despite the lower return generated on assets.
Growth differences reflect geography as well as scale
The uneven relationship between size and growth also sits alongside substantial differences between banking markets.
Excluding banks in economies with inflation above 20%, weighted-average asset growth in banks’ reported currencies increased from 4.9% in FY2024 to 7.1% in FY2025.
The acceleration was driven disproportionately by the United States (US) and China. The US contributed 0.99 percentage points to the 2.2-percentage-point increase in weighted-average growth, while China contributed another 0.58 percentage points. Together they accounted for about 70% of the acceleration, reflecting the influence of their large banking systems within an asset-weighted calculation.
But regional medians diverged considerably.
The Middle East recorded median asset growth of 11.6%, up from 8.8%, while North America doubled from 2.4% to 4.8%. Europe edged up from 4.5% to 4.7%.
Asia Pacific eased from 6.8% to 6.4%, Africa from 10.3% to 10.1%, while Latin America and the Caribbean slowed more sharply from 9.0% to 4.2%.
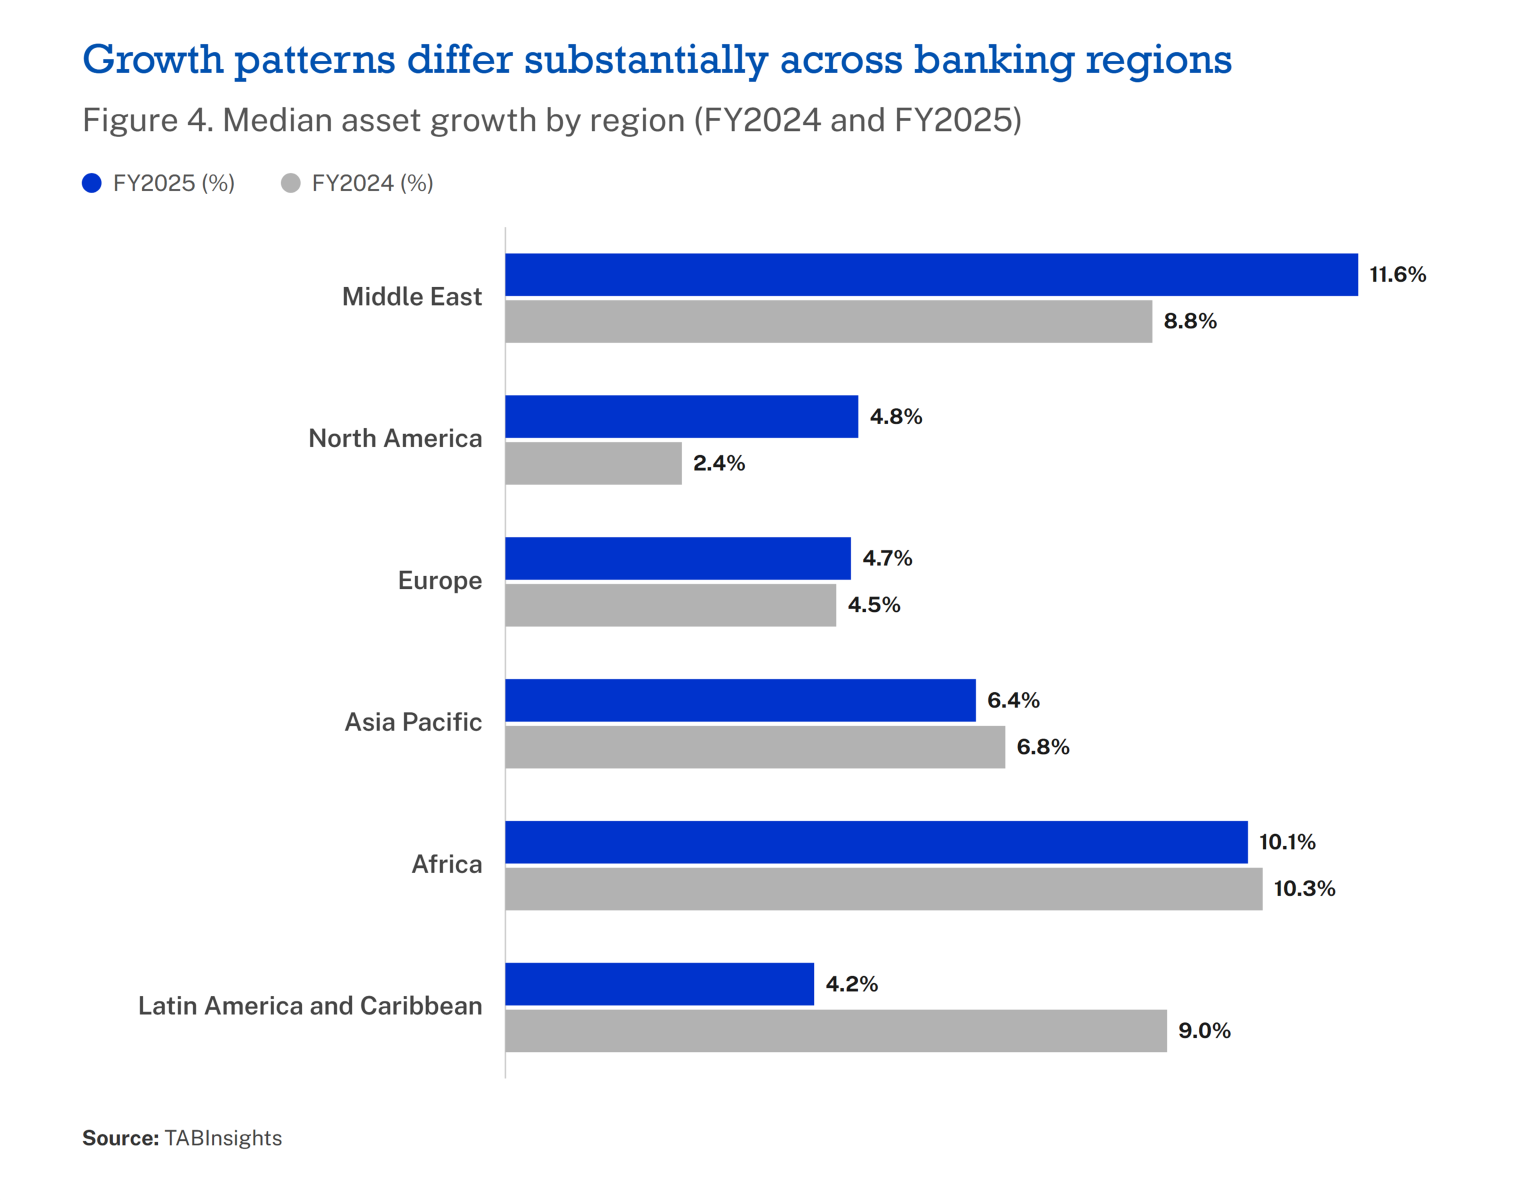
The differences were larger at market level.
Median asset growth in the United Arab Emirates increased from 13.3% to 17.7%, India from 10.2% to 13.1% and Vietnam from 17.2% to 20.6%. Italy moved from a 0.6% contraction to 5.5% growth.
Other markets moved in the opposite direction. Taiwan slowed from 7.6% to 5.6%, while Nigeria’s exceptionally high previous growth normalised as the balance-sheet revaluation effect of the naira’s earlier depreciation faded.
The regional comparison reinforces the broader finding that size alone does not determine growth. Market structure, economic conditions, currency movements, business models and balance-sheet composition all influence how banks expand.
Sustainable growth depends on how it is funded
Growth also has to be considered alongside funding.
Loans grew faster than deposits at 544 of the world’s 1,000 largest banks in FY2025. That does not in itself indicate a funding problem.
The more significant pattern emerges over time.
Some 404 banks grew loans faster than deposits in at least three of the four years to FY2025. These institutions recorded median annual loan growth of 8.6% compared with deposit growth of 5.0%. Their median loan-to-deposit ratios increased by ten percentage points, while debt increased by one percentage point as a share of liabilities.
The implications differed substantially between markets.
Over the four years to FY2025, Japanese banks recorded median annual loan growth of 4.1% compared with deposit growth of 1.7%, lifting the median loan-to-deposit ratio (LDR) from 71.0% to 77.0%. Debt nevertheless declined as a proportion of liabilities.
India followed a different path. Median annual loan growth was 15.8% against deposit growth of 10.4%, raising the median LDR from 74.5% to 84.5%.
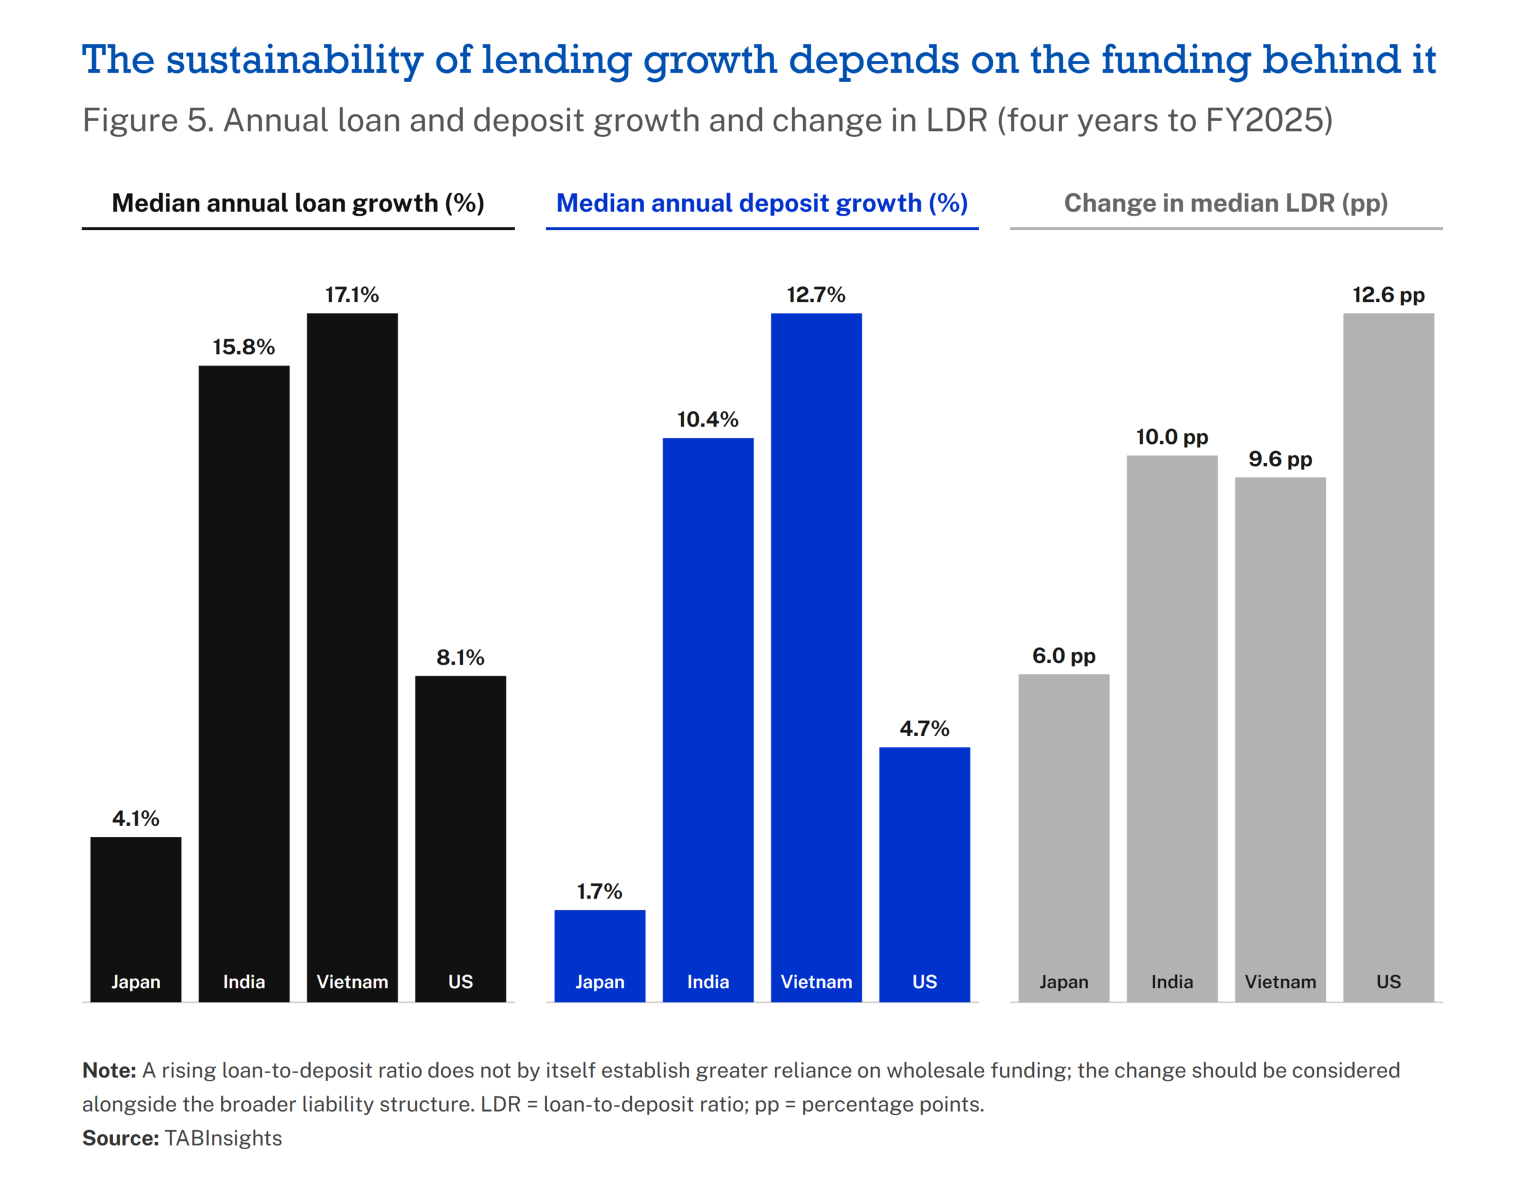
The divergence between loan and deposit growth was more pronounced in Vietnam. Median annual loan growth was 17.1% against deposit growth of 12.7%, while the median LDR increased from an already high 96.0% to 105.6%.
In the US, median annual loan growth was 8.1% over the period compared with deposit growth of 4.7%, raising the median LDR from 73.6% to 86.2%.
A rising LDR is not inherently problematic. Nor does a high LDR by itself indicate funding stress.
The more relevant question is whether sustained lending growth relative to deposits increases reliance on wholesale or other market funding, and what that means for funding costs and refinancing exposure.
Japan demonstrates the distinction. Its LDR increased as lending outpaced deposits, but remained comparatively low and debt declined as a proportion of liabilities. A rising LDR therefore does not by itself establish greater reliance on wholesale funding; the change has to be considered alongside the bank’s broader liability structure.
The sustainability of balance-sheet expansion therefore depends not only on how quickly a bank can grow loans, but on the funding structure supporting that growth.
Turning scale into economic advantage
The 2026 Largest Banks ranking demonstrates the extraordinary concentration of global banking assets. Cross-tabulating size against the underlying financial data also shows the limits of what scale alone can explain.
Its clearest observed financial association is with asset quality. Median NPL ratios increase progressively as bank size falls, from 1.22% among the largest 100 to 2.20% among the smallest 250.
But neither growth, profitability nor efficiency follows the same pattern.
The largest 100 banks do not grow fastest. They generate lower median ROA than several smaller groups. Banks ranked 101st to 250th operate with a substantially lower median cost-to-income ratio. And the share of global banking income and profit generated by the largest institutions is smaller than their share of assets.
Scale therefore represents capacity rather than guaranteeing superior economics.
How that scale translates into financial performance reflects balance-sheet composition, operating efficiency, the funding structures supporting growth and the economic and financial environments in which banks compete.
For the world’s largest banks, becoming bigger is therefore only part of the equation. The more important challenge is turning scale into sustainable earnings and growth without sacrificing efficiency, asset quality or funding resilience.
What is TAB Global 1000?
TAB Global 1000 is an annual study of the financial and business performance of the banking industry in the world. The study comprises two different lists: the first ranks the top 1,000 banks in the world by asset size, while the second ranks the same 1,000 banks by strength of their balance sheets, an evaluation that is based on a belief that a strong bank demonstrates long-term profitability from its core businesses.
Which banks are included?
The assessment covers both banks and financial holding companies with significant activity in banking. The evaluation does not include central banks, policy banks or finance companies.
How do we collect and treat the data?
Bank annual reports are our main sources of data. In the absence of up-to-date annual reports, we contact banks directly to source financial results for the financial year 2025, with a March 2026 cutoff. Consolidated figures are used for banking groups, except when non-banking activities form a substantial portion of the consolidated figures, in which case we look at the banking unit independent of its parent. All figures are quoted in United States dollars. Year-on-year growth rates are calculated based on original local currency figures.
View the full ranking for the TAB Global 1000 World’s Largest Banks 2026.











 Google
 LinkedIn