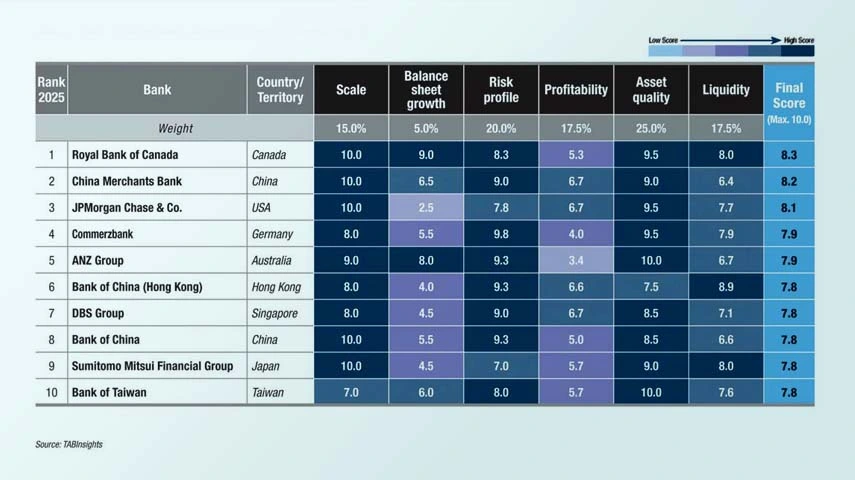

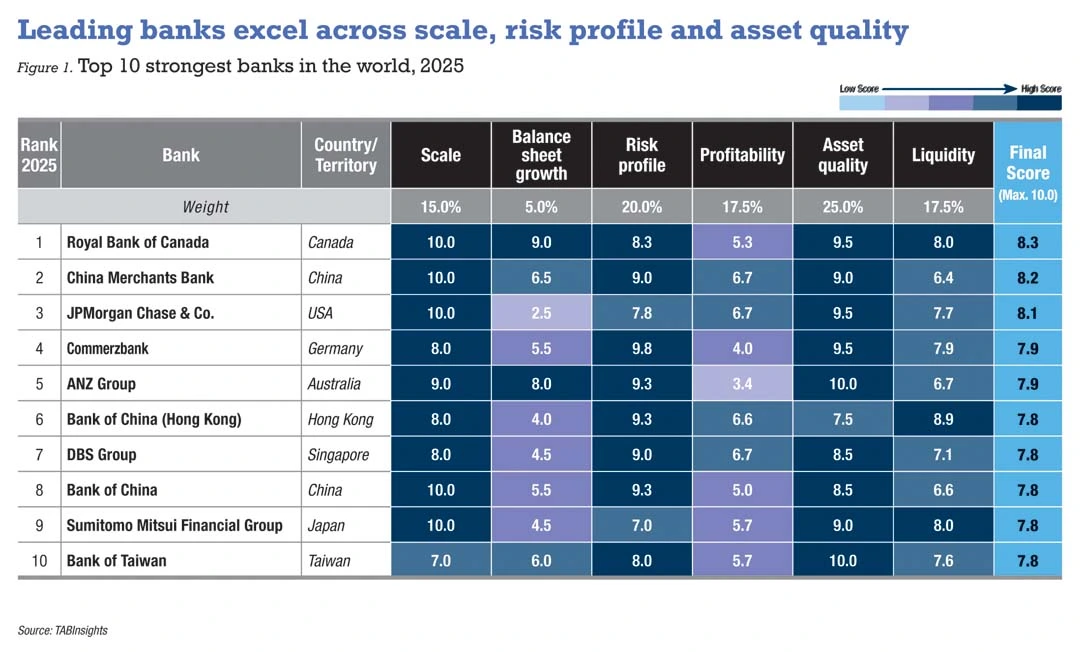
Royal Bank of Canada, China Merchants Bank and JPMorgan Chase hold the top three positions in the TAB Global 1000 World’s Strongest Banks ranking for 2025. The ranking covers 1,000 banks from 100 countries, territories and special administrative regions, evaluating their performance in the financial year (FY) 2024, with a cutoff date at the end of March 2025.
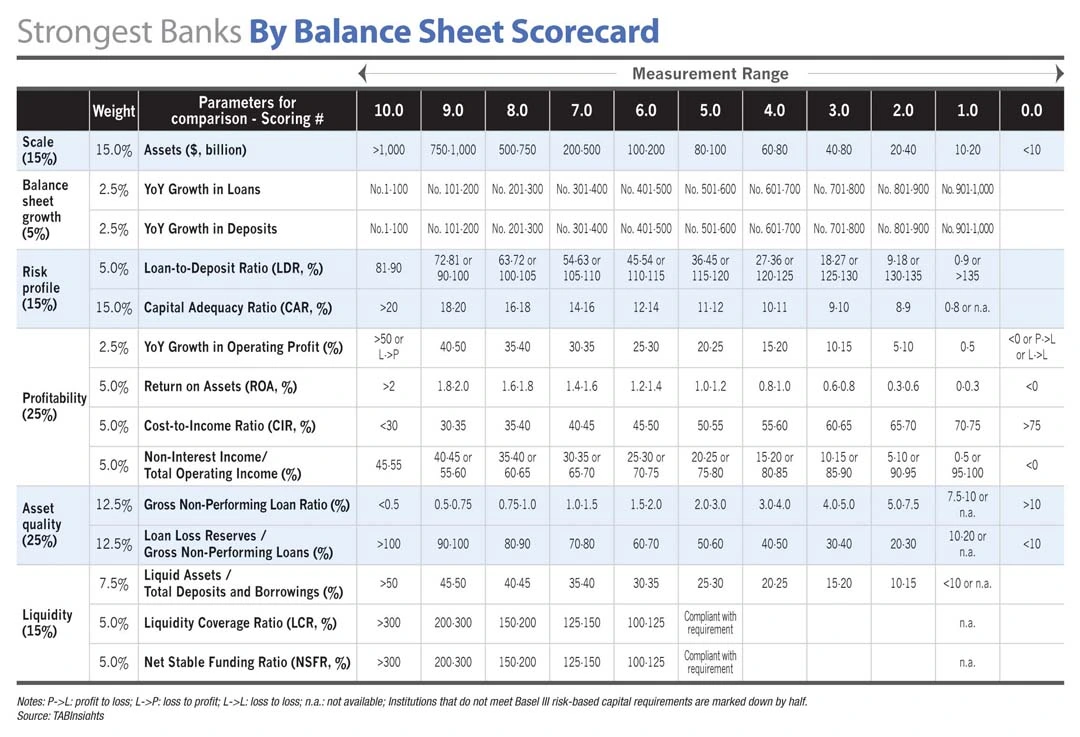
The TAB Global 1000 World’s Strongest Banks ranking evaluates the 1,000 largest banks worldwide based on balance sheet strength. It employs a detailed and transparent scorecard to assess banks and financial holding companies across six criteria: scale, balance sheet growth, risk profile, profitability, asset quality and liquidity, comprising 14 specific factors.
The ranking includes 432 banks from Asia Pacific, 223 from Europe, 155 from North America, 84 from Latin America and the Caribbean, 64 from the Middle East, 34 from Africa and eight from Central Asia, with some adjustments to regional classification compared with last year. Notably, the strongest banks in markets including Australia, Canada, China, Germany, Hong Kong, Hungary, Israel, Japan, Mexico, Saudi Arabia, Singapore, Taiwan and the United States (US) are all in the top 20.
The global banking sector remained broadly stable in FY2024. Regional differences continued to shape performance, with emerging markets benefiting from higher lending spreads and stronger loan demand but facing elevated credit and liquidity pressures, while advanced markets maintained stable asset quality and diversified income, albeit with persistent constraints on profitability and efficiency.
Return on assets (ROA) held steady, although margins were compressed due to competitive pressures and higher funding costs. Operational efficiency improved modestly despite rising technology and regulatory expenses, with Central Asia and the Middle East reporting the lowest cost-to-income ratio (CIR), while North America and Europe continued to face higher structural costs. Income diversification progressed gradually, with banks in North America and Europe contributing a higher share of non-interest income to total operating income, whereas Asia Pacific, the Middle East and Central Asia remained largely reliant on lending.
Asset quality remained broadly resilient, although Africa, Latin America and the Caribbean, and Central Asia showed higher credit vulnerabilities. Elevated loan-to-deposit ratios in Central Asia and Latin America and the Caribbean suggest relatively stretched positions, while Asia Pacific, the Middle East and Europe operated within more balanced ranges. Liquidity largely remained sound, and capitalisation improved slightly, with European, Central Asian and Middle Eastern banks maintaining stronger positions.
Earnings strength and resilience underpin top 10 banks
Royal Bank of Canada ranks first globally with a score of 8.3 out of 10, supported by a diversified model across business segments and geographies, prudent risk management and solid capital and liquidity position. Within the top 10 strongest banks, Royal Bank of Canada derived 51.3% of its operating income from non-interest sources in FY2024, the highest among its peers. Its asset quality remained strong, with a gross non-performing loan (NPL) ratio of 0.6% in FY2024, while liquidity was robust, reflected in a liquid assets-to-total deposits ratio of 52% and a liquidity coverage ratio (LCR) of 128%.
The acquisition of HSBC Canada, completed in March 2024 as the largest deal in Royal Bank of Canada’s history, expanded its client base and global banking capabilities and created opportunities for cost synergies and growth. Beyond Canada, the bank continues to build scale in the US and expand in Europe and other regions, supporting long-term diversification.
China Merchants Bank holds the second position globally, underpinned by a stronger risk profile and higher profitability than Royal Bank of Canada. Its ROA declined slightly to 1.3% in FY2024, while its CIR improved to 34.1%. The bank has been steadily reshaping its business mix, with non-interest income rising to 37.3% of operating income, signalling greater diversification beyond lending. At the same time, its capital position strengthened, with the total capital adequacy ratio (CAR) rising to 19.1% from 17.9% in FY2023.
Although China Merchants Bank’s liquidity remains weaker than Royal Bank of Canada, it has improved in recent years. A strong retail franchise and access to affluent clients underpin its stable deposit base and funding cost advantage. Its deposit growth has consistently outpaced loan growth, reducing the net loan-to-deposit (LDR) from 88% in FY2019 to 72% in FY2024, while reliance on short-term wholesale funding has declined.
JPMorgan Chase occupies the third spot globally, backed by a broad range of services, strategic technology investments and a “fortress balance sheet” philosophy emphasising strong liquidity, low leverage and robust capital. The bank has expanded its market share across multiple business lines while maintaining strict risk discipline. Its profitability strengthened, with ROA rising from 1.3% in FY2023 to 1.4% in FY2024, CIR falling from 53.7% to 52.7% and non-interest income as a share of total operating income increasing from 42.4% to 45.4%. The bank also maintained strong asset quality and solid capitalisation, with a CAR of 17.9%, alongside robust liquidity reflected in a liquid assets-to-total deposits ratio of 64%.
Commerzbank, now the strongest bank in Europe, rose to fourth globally, benefit from sharper profitability and an improved risk profile. Its ROA, CIR and non-interest income ratios all improved, with CIR falling to 58.5% in FY2024 due to robust income growth across multiple business lines, aided by restructuring and digital investments. Stronger capitalisation — Tier 1 capital ratio rising to 17.6% and total CAR to 20.9% — reinforced resilience, while its risk profile was the highest among the global top 10. Asset quality also held firm, with its gross NPL ratio edging down slightly to 0.6%.
Other banks in the global top 10 include ANZ, Bank of China (Hong Kong), DBS, Bank of China, Sumitomo Mitsui Financial Group and Bank of Taiwan. DBS delivered strong profitability with a ROA of 1.4% and a CIR of 40%, while Bank of China (Hong Kong) stood out for efficiency, with a CIR of 24.8%. Sumitomo Mitsui Financial Group and Bank of Taiwan posted non-interest income ratios above 40%, highlighting robust diversification. In terms of capital and liquidity, Bank of China (Hong Kong) and ANZ maintained CARs above 20%, while Bank of China (Hong Kong) and Sumitomo Mitsui Financial Group reported strong liquidity, including an LCR of 201% and a net stable funding ratio (NSFR) of 142% for Bank of China (Hong Kong).
Global banking performance
Global banking stability backed by profitability, assets, capital and liquidity
The top 1,000 banks recorded a weighted average ROA of 0.81% in FY2024, unchanged from 0.81% in FY2023, reflecting broadly stable global profitability. ROA declined marginally in Europe and Asia Pacific, while other regions saw modest improvements. Central Asia and Africa recorded the strongest ROA, Latin America and the Caribbean and the Middle East achieved mid-range levels, and Europe and Asia Pacific lagged behind.
The global average net interest margin (NIM) contracted from 2% to 1.8% driven by competitive pressures and rising funding costs. Margin compression was observed across most regions, underscoring persistent challenges in balancing profitability and funding costs. Latin America and the Caribbean, Central Asia and Africa maintained the widest margins, while Asia Pacific and Europe recorded the narrowest.
Operational efficiency improved slightly, with the average CIR down from 49.5% in FY2023 to 48.9%, despite rising technology and regulatory expenses. Banks in Central Asia and the Middle East achieved the lowest CIRs, supported by lean cost structures and solid income generation. Asia Pacific and Africa recorded moderate efficiency, whereas Latin America and the Caribbean saw high operating costs. CIRs remain the highest in North America and Europe, shaped by competitive markets and elevated structural costs.
Income diversification advanced gradually, with non-interest income rising from 34.2% to 35.6% of total operating income. Mature markets showed stronger diversification through fee-based income, while emerging markets — particularly Asia Pacific, the Middle East and Central Asia — remained lending-dependent, with non-interest income ratios below 30%.
Asset quality remained broadly resilient, with the global gross NPL ratio improving slightly to 1.63% from 1.66%. Risks, however, remained concentrated in emerging markets. Africa reported the highest NPL levels globally, which increased further in FY2024, highlighting persistent credit vulnerabilities. Latin America, the Caribbean and Central Asia saw some improvement, but NPLs remained elevated, underscoring the trade-off between strong margins and heightened credit risks.
Funding structures remained broadly stable, with the average LDR steady at 82%. North American banks maintained loan-to-deposit ratios (LDRs) well below the global average, reflecting greater reliance of corporate financing on developed capital markets. Asia Pacific, the Middle East and Europe operated within balanced ranges, while Central Asia and Latin America and the Caribbean reported the highest LDRs, supporting short-term profitability but exposing them to potential liquidity pressures stemming from dependence on external funding.
Overall capitalisation improved, while liquidity remained generally sound. Banks meeting Basel III capital requirements recorded an average Tier 1 capital ratio of 15%, up from 14.8%, and a CAR rising from 17.2% to 17.5%. European, Central Asian and Middle Eastern banks maintained stronger capital buffers, whereas African banks lagged. Liquidity remained sound, with liquid assets averaging 39% of deposits and borrowings globally, and European banks holding the highest levels. Among those reporting regulatory metrics, the average LCR stood at 158% and the NSFR at 127%, reflecting a gradual move across more markets towards these liquidity standards.
Performance trends highlight regional banking differences
Across regions, North American banks recorded a ROA of 0.9% in FY2024, up from 0.84% in 2023, despite a slight contraction in NIM from 2.5% to 2.4% due to competitive pressures on deposits. Non-interest income remained a key driver of profitability, contributing 44.4% of total operating income, up from 42.3% in FY2023, the largest share across regions. Operational efficiency remained constrained, with the average CIR at 61.3%, the highest worldwide, reflecting significant technology, talent and branch costs. Asset quality was resilient, although gross NPL ratios increased slightly from 0.65% to 0.72%.
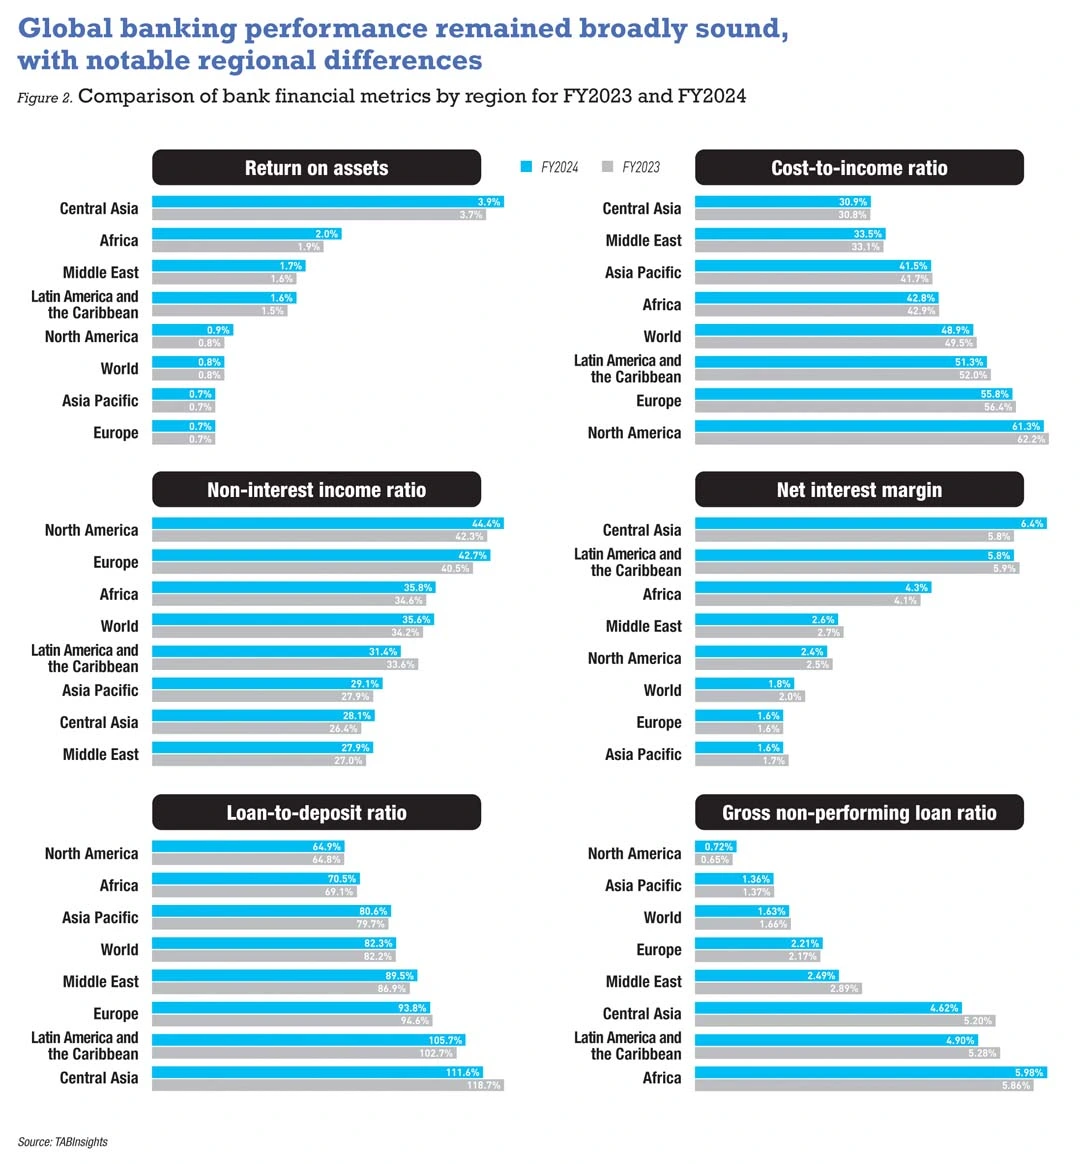
In Asia Pacific, ROA averaged 0.73%, marginally down from FY2023, with NIM declining from 1.7% to 1.6%. Banks continued to rely largely on lending, even as the average non-interest income to total operating income ratio increased from 27.9% to 29.1%, staying at a modest level. CIR improved slightly to 41.5%, supported by digitalisation and cost rationalisation. The gross NPL ratio stood at 1.4%, with credit risks contained although vulnerabilities persist in some markets.
Middle Eastern banks maintained steady profitability, with ROA at 1.68% compared with 1.63% in 2023, while NIM narrowed slightly from 2.7% to 2.63%. Operational efficiency remained among the highest globally, with CIR at 33.5%, reflecting lean structures and cost-conscious operations. Non-interest income was limited at 27.9%, underscoring reliance on traditional lending and commodity-linked revenue streams, while NPL ratios improved to 2.49% from 2.89%, despite ongoing exposures to geopolitical and commodity-related risks.
European banks reported an average ROA of 0.73%, with NIM stable at 1.6%, indicating limited scope for margin expansion in a low-interest-rate environment. Non-interest income rose to 42.7% from 40.5%, helping offset narrow spreads, but operational efficiency remained weak, with CIR at 55.8%, weighed down by elevated regulatory compliance costs, the complexity of cross-border operations and ongoing restructuring expenses. Gross NPL ratios remained steady at 2.2%, with lingering legacy exposures in some markets.
Central Asian banks posted the highest ROA globally at 3.93% in FY2024, up from 3.85% a year earlier, supported by wide margins of 5.4% and strong credit expansion. Although NIM narrowed from 6.4% to 5.8%, it remained the widest of any region. CIR was the lowest globally at 30.9%, while non-interest income stayed modest at 28.1%. Elevated LDRs and NPLs signalled vulnerabilities, even as LDRs fell from 118.8% to 111.6% and NPL ratios improved from 5.2% to 4.6%, reflecting concerns over the sustainability of rapid loan growth.
In Latin America and the Caribbean, ROA improved to 1.64% from 1.53%, with NIM remaining high at 5.8%, reflecting banks’ ability to price risk amid volatile conditions. Operational efficiency challenges persist, as shown by a CIR of 51.3%, largely due to reliance on physical networks and high regulatory compliance costs. Gross NPLs eased slightly to 4.90% from 5.28%, yet asset quality remains under pressure, and elevated LDRs at 105.7% point to the need for prudent liquidity management.
In Africa, banks recorded an increase in ROA from 1.90% to 2.04%, supported by NIMs rising to 4.3% from 4.1%, while non-interest income accounted for 35.8% of total operating income. However, asset quality challenges persisted, with NPLs rising from 5.9% to 6.0%, the highest globally. This highlights structural weaknesses in borrower resilience and credit risk management, constraining sustainable profitability — particularly in economies exposed to volatility and political uncertainty.
North America and Asia Pacific post strongest balance sheet scores
The weighted average strength score of the top 1,000 banks stands at 6.93 out of 10, with North American and Asia Pacific banks leading at 7.20 and 7.02, respectively. North American banks stand out in scale and asset quality, while Asia Pacific banks, compared with their North American peers, show stronger balance sheet growth, better risk profile and higher profitability, but lag in scale, asset quality and liquidity.
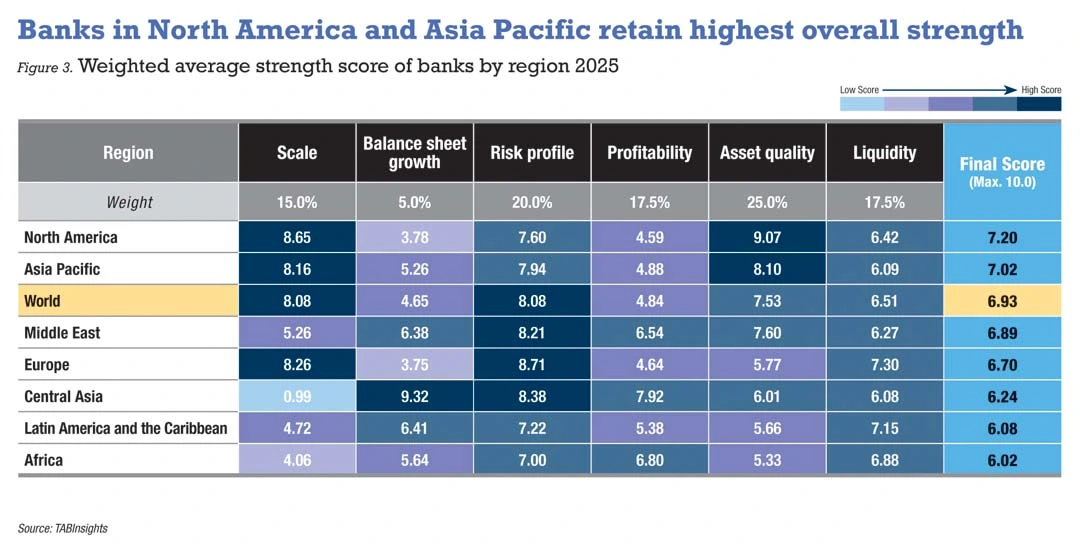
All other regions score below the global average. The Middle East, at 6.89, is notable for strong growth, solid risk profile and robust profitability, despite relatively smaller scale. Europe follows at 6.70, supported by high liquidity and a sound risk profile, but constrained by weak balance sheet growth and below-average profitability and asset quality.
Central Asia records a score of 6.24, ahead of Latin America and the Caribbean at 6.08, and Africa at 5.99. While these regions achieve relatively high profitability, they face persistent challenges such as weaker asset quality, economic volatility, less mature financial systems, and, in some cases, political instability. Central Asia outperforms both Latin America and the Caribbean and Africa in terms of risk profile and profitability.
Canadian banks bolstered by prudent regulation and conservatism
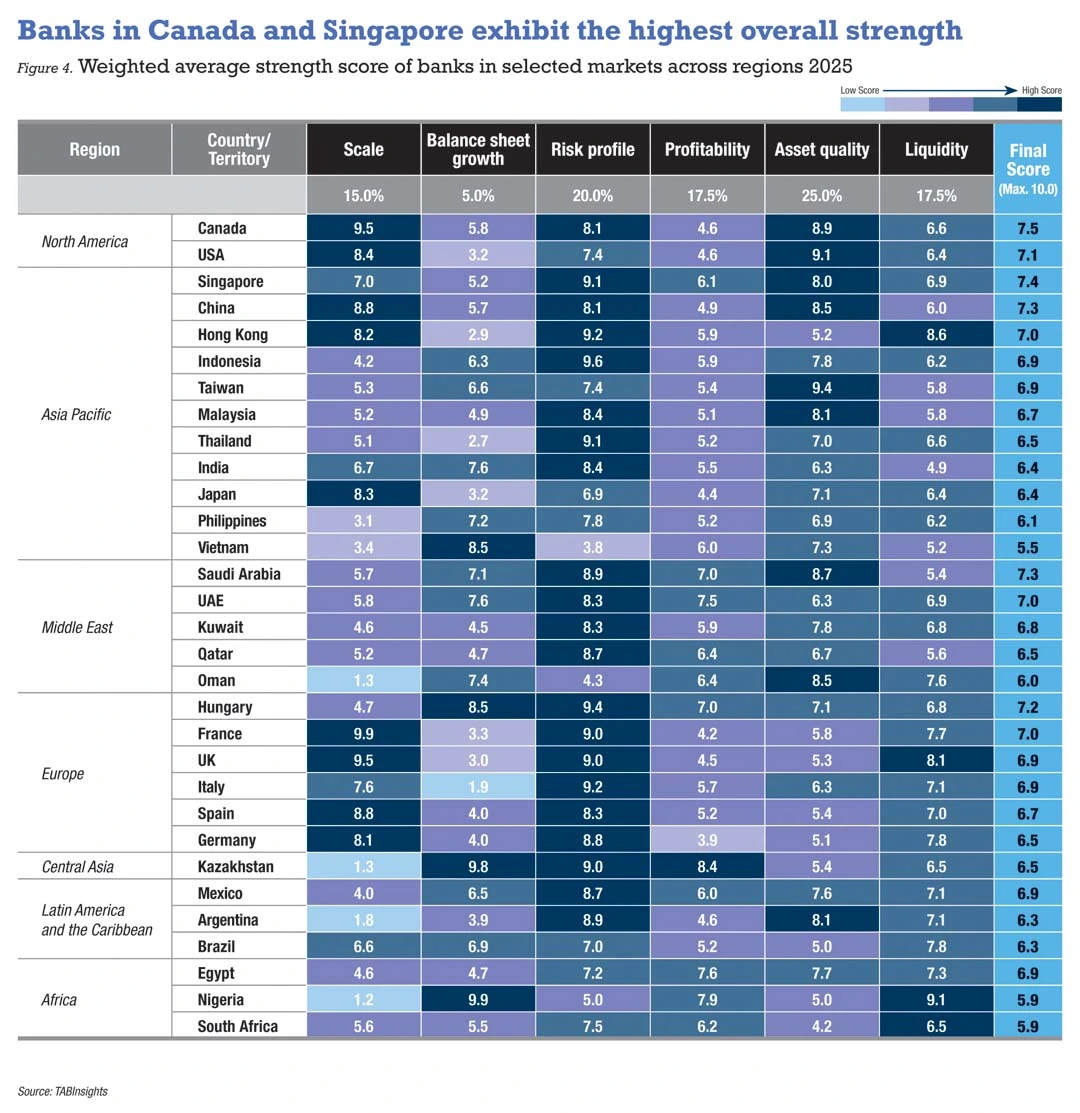
Canadian banks remain the strongest globally, with an average score of 7.5, supported by prudent regulation, conservative risk management and diversified operations. The banking sector follows a conservative framework with strict capital, liquidity and risk requirements that safeguard stability. Canadian banks also adopt careful lending practices, avoiding high-risk loans and securitisation strategies that triggered crises elsewhere. Diversified portfolios across sectors, geographies and products further mitigate risks. Canada’s banking market is concentrated yet competitive, with the “Big Six” banks dominating. This oligopoly structure provides economies of scale, enabling banks to operate efficiently and diversify income streams, sustaining profitability and resilience.
On average, Canadian banks posted higher profitability and liquidity scores compared with the previous year, while their asset quality and risk profile scores declined. Relative to US banks, they score higher in all dimensions except asset quality. The weighted-average impaired loan ratio for Canadian banks rose from 0.52% in FY2023 to 0.67%, largely driven by weaknesses in auto loan books, commercial real estate portfolios and exposure to the transportation sector, but it remained low despite these pressures. Meanwhile, the average provision coverage ratio fell from 141% to 113%. By contrast, US banks improved their risk profile, profitability and liquidity scores over the same period.
All of Canada’s Big Six banks are ranked among the top 10 strongest in North America. Following Royal Bank of Canada, Canadian Imperial Bank of Commerce ranks third in the region and 16th globally, while Toronto-Dominion Bank ranks eighth in the region and 50th globally. Seven US banks are ranked within the global top 100, but only JPMorgan Chase is in the top 20. Bank of America and Citigroup ranked fourth and fifth in the region, respectively.
Singapore, Australia excel in resilience, China retains scale
Singapore achieves the highest average score in the Asia Pacific at 7.4, followed by Australia at 7.4, China at 7.3 and Hong Kong at 7.0. Singapore banks outperform their Chinese peers in risk profile, profitability and liquidity, while China scores higher in scale, balance sheet growth and asset quality. Year-on-year, Singapore has improved in balance sheet growth and risk profile. Capital levels strengthened even as loan growth accelerated, with total CAR rising from 17.5% in FY2023 to 19.4% in FY2024, supported by robust earnings.
China also gained in risk profile, driven by the implementation of the New Capital Rules and capital replenishment, raising the average total CAR of Chinese banks from 15.8% to 16.6%. However, balance sheet growth and profitability declined, with the average NIM narrowing from 1.66% to 1.5%, and average ROA decreasing from 0.75% to 0.7%. Elsewhere in the region, Indonesia, Taiwan, South Korea, Malaysia and Thailand have average scores above 6.5, while India and Japan score 6.4, and the Philippines 6.1.
The top 20 strongest banks in Asia Pacific include eight from China, three from Australia, two from Hong Kong, two from Indonesia, two from Singapore, and one each from Japan, Pakistan and Taiwan. China Merchants Bank leads the region, while Bank of China, China Construction Bank and Bank of Nanjing rank fifth, ninth and 10th, respectively. Among these four Chinese banks, Bank of Nanjing posted the highest profitability, supported by a non-interest income to total operating income ratio of 47.1%, where trading gains contributed more than fees and commissions, indicating an area to monitor for income stability. The bank also recorded a lower gross NPL ratio and stronger liquidity, but its capital level remained comparatively lower.
ANZ, Bank of China (Hong Kong) and DBS occupy the second, third and fourth positions in the region. Bank of China (Hong Kong) and ANZ demonstrated stronger capitalisation than DBS, with CARs of 22% and 20.6% respectively, despite DBS raising its CAR from 16.1% in FY2023 to 18.6% in FY2024. ANZ excelled in asset quality, but profitability remained modest, with a ROA of 0.6%, a CIR of 52.4% and non-interest income accounting for 21.8% of total operating income. By contrast, DBS posted a ROA of 1.4%, a CIR of 40% and non-interest income of 36% of total operating income, while Bank of China (Hong Kong) recorded a ROA of 1%, a CIR of 24.8% and non-interest income of 34%, reflecting both efficiency and diversified revenue streams.
The strongest banks in Japan, Taiwan, Indonesia, and Pakistan—Sumitomo Mitsui Financial Group, Bank of Taiwan, Bank Central Asia and Meezan Bank—rank sixth, seventh, 15th and 16th, respectively. Sumitomo Mitsui Financial Group outpaced Mitsubishi UFJ Financial Group and Mizuho Financial Group in balance sheet expansion, profitability and asset quality, while the latter two retain a more robust capital base. Bank of Taiwan displayed a sound risk profile, high-quality assets and ample liquidity. In Indonesia, Bank Central Asia achieved higher profitability than Bank Mandiri, with an ROA of 3.8% and a CIR of 34.8%, compared with Bank Mandiri’s ROA of 2.7% and CIR of 41.2%. Nonetheless, Bank Mandiri exhibits better asset quality, with a gross NPL ratio of 1.2% versus 1.7% for Bank Central Asia. Meezan Bank maintained robust capital and liquidity, while achieving a high ROA of 3.1% and a low CIR of 26.9%, but non-interest income, at 10.9% of total revenue, remained a constrained source.
Saudi leads Middle East, UAE improves in asset quality and liquidity
Saudi Arabia attains the highest average score in the Middle East at 7.3, ahead of the UAE at 7.0, Kuwait at 6.8 and Qatar at 6.5. Saudi Arabian banks excel in risk profile and asset quality, while UAE banks are stronger in profitability and liquidity. Compared with last year, Saudi Arabia recorded lower scores in risk profile, profitability and liquidity, while the UAE also slipped in profitability but improved in asset quality and liquidity. Qatari banks average 6.5, below the regional 6.9, weighed down by weaker asset quality and liquidity, though their risk profile remained sound.
The top 10 strongest banks in the region include four from Saudi Arabia, three from the UAE, two from Kuwait and one from Israel. Al Rajhi Bank ranks first in the region and 12th globally, while Saudi Arabia’s Riyad Bank, Saudi Awwal Bank and Saudi National Bank rank third, fifth and seventh, respectively. These Saudi banks deliver robust profitability, capitalisation and asset quality, but weaker liquidity. Al Rajhi Bank strengthened its profitability, with ROA rising from 2.1% in FY2023 to 2.3% in FY2024 and the CIR improving from 27.2% to 24.9%.
Commercial Bank of Kuwait, the strongest in Kuwait, ranks fourth in the region. Despite its smaller size, it achieves high profitability, with ROA rising from 2.6% to 3.5%, while maintaining a zero NPL ratio since 2018. In the UAE, Mashreqbank stands out as the strongest, ranking sixth, ahead of Emirates NBD and Abu Dhabi Commercial Bank, which rank eighth and ninth. Mashreqbank outperforms both peers in profitability and asset quality, with an ROA of 3.6% compared with 2.5% for Emirates NBD and 1.5% for Abu Dhabi Commercial Bank. Its gross NPL ratio was 1.7% in FY2024, lower than Abu Dhabi Commercial Bank’s 2.4% and Emirates NBD’s 3.3%.
Commerzbank lifts Europe, Hungary improves risk profile and asset quality
Finland, France, Hungary, Italy, Portugal, Turkey and the UK are among the countries with an average score above the regional average of 6.7. Hungary and Finland achieve the highest scores at 7.2 and 7.1, respectively. Hungary performs well in risk profile, profitability and asset quality, with improvements in risk profile and asset quality compared with last year, although profitability has declined. Finland shows a balanced performance across all dimensions, but its asset quality score has decreased. French banks outperform their UK counterparts in asset size, balance sheet growth and asset quality, as UK banks experienced a decline in asset quality. Italian banks surpass both UK and French banks in risk profile, profitability and asset quality.
Commerzbank is the strongest bank in Europe, followed by OTP Bank from Hungary, which ranks 17th globally. These two are the only European institutions in the top 20 strongest banks worldwide. OTP Bank demonstrated robust capitalisation and liquidity, with higher profitability than Commerzbank, posting an ROA of 2.6% and a non-interest income to total operating income ratio of 34.5%, although its asset quality was weaker, with a gross NPL ratio of 3.2%.
In total, 25 European banks rank among the top 100 strongest banks globally, down from 28 in the previous year. Caixa Geral de Depósitos from Portugal ranks third in the region and 22nd globally, Crédit Agricole from France is fourth in the region and 27th globally, and Finland’s Nordea Bank is fifth in the region and 30th globally. The strongest banks in Italy, Spain, Switzerland and the UK—UniCredit, Banco Bilbao Vizcaya Argentaria, Zürcher Kantonalbank and Barclays—rank seventh, 13th, 15th and 20th in the region, respectively.
Kazakhstan excels on profitability in Central Asia
Kazakhstan, Azerbaijan and Uzbekistan achieve average scores of 6.5, 6.1, and 5.6, respectively, all with high balance sheet growth. Kazakhstan outperforms in risk profile and profitability, while Azerbaijan and Uzbekistan score higher in asset quality.
The top three strongest banks in the region are all from Kazakhstan, with Bank CenterCredit ranked as the strongest. Compared with Halyk Bank, the largest bank in the region, Bank CenterCredit demonstrated stronger asset quality and liquidity, while Halyk Bank showed higher profitability and capitalisation. Bank CenterCredit’s gross NPL ratio improved to 3.6% in FY2024 with a provision coverage ratio of 110%, compared with Halyk Bank’s gross NPL ratio of 6.2% and provision coverage of 77%. In terms of profitability, Halyk Bank posted an ROA of 5.5%, whereas Bank CenterCredit recorded 3.4%. However, Bank CenterCredit has a higher non-interest income to total operating income ratio of 31.3%, compared with 25.8% for Halyk Bank.
Mexico leads Latin America with balanced performance
Mexico achieves the highest average score in the region at 6.7, ahead of Argentina and Brazil, both at 6.3. Mexico and Brazil both display balanced profiles, but Mexico outperforms in risk profile, profitability and asset quality. Argentine banks show solid resilience amid high inflation and currency depreciation, scoring high in risk profile and improving asset quality, but profitability declined. Colombia scores 5.3, underperforming in profitability, and Chile scores 5.1, with weaker asset quality. The top 10 strongest banks in Latin America and the Caribbean include five from Mexico, two from Argentina, and one each from Brazil, the Dominican Republic and Uruguay.
BBVA México, Banco Mercantil del Norte and Banco Inbursa are the three strongest banks in the region, all from Mexico. BBVA México has a solid market position as the largest bank in the country, with robust asset quality, capital and liquidity. It posted a high ROA of 3% in FY2024 and one of the lowest CIRs in the region at 33%, supported by investments in digital channels and modernisation that have improved efficiency and customer reach. Itaú Unibanco Holding remains the strongest bank in Brazil, ranking fifth in the region, with improved asset quality and strong liquidity. Its profitability also improved in FY2024, with ROA rising to 1.6% and CIR declining to 51.7%, supported by a diversified revenue base, with non-interest income accounting for 56.4% of operating income.
Egypt leads Africa with profitability and asset quality
Overall, Egypt and Mauritius achieve the highest average scores in Africa, at 6.9 and 6.2, respectively. Egypt excels in profitability and asset quality, while Mauritius also performs well in risk profile, profitability and asset quality. Nigeria and South Africa both record an average score of 5.9.
The top 10 strongest banks in Africa include three from Egypt, three from South Africa, two from Nigeria, and one each from Mauritius and Morocco. The three strongest banks in the region are all Egyptian, with Banque Misr showing strong profitability and exceptionally strong liquidity, National Bank of Egypt recording high profitability and better asset quality, and Commercial International Bank demonstrating highly solid capitalisation.
Zenith Bank, the strongest bank in Nigeria, ranks fourth in the region, supported by high profitability, improved asset quality and strengthened capitalisation. Mauritius Commercial Bank, the strongest in Mauritius, comes fifth. Capitec Bank Holdings, the strongest in South Africa, ranks sixth, with the highest ROA and lowest CIR among South Africa-based banks, leveraging a lean branch network and strong digital channels. Asset quality remains its main weakness, prompting the bank to reduce reliance on unsecured retail loans, while capital and liquidity are exceptionally strong.
Overall, the 2025 edition of the TAB Global 1000 World’s Strongest Banks ranking underscores the resilience and adaptability of the global banking sector amid diverse operating conditions. Regional variations remain evident, but leading banks continue to strengthen capital, liquidity and diversification, reinforcing stability and competitiveness. As regulatory frameworks evolve and technological transformation accelerates, banks’ ability to balance growth, efficiency and prudent risk management will remain decisive for sustaining long-term strength.
BANK WATCH LIST
Bangladesh exhibits the highest asset quality challenges
Balance sheets and financial results-based evaluations are, by nature and definition, backward-looking. To overcome this, we introduced a forward-looking element called the “Bank Watch List” into the strongest bank evaluation.
What is the Bank Watch List?
It identifies and considers the impact of specific evaluation parameters on balance sheet strength, should macroeconomic and business conditions change.
By identifying the parameters and institutions that are most likely to be impacted by such changes, we aim to provide a holistic 360-degree view of the ranking without materially changing the composition of the scorecard. The identification and setting of the parameters are based on analysis by TABInsights, the research arm of The Asian Banker, of past performance as well as outlook of the banking sector in the region.
Who are in the Bank Watch List?
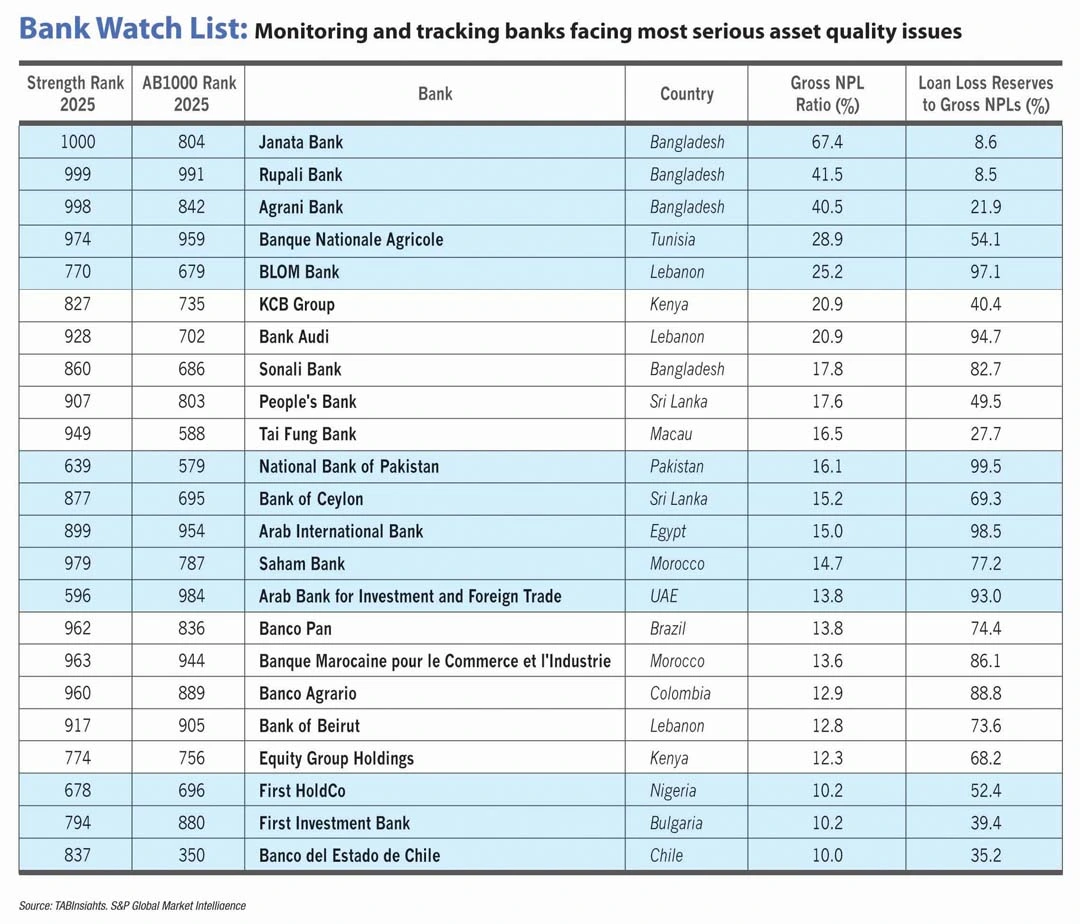
This year’s Bank Watch List includes four banks from Bangladesh, three from Lebanon, two from Sri Lanka, two from Kenya, two from Morocco, and one each from Brazil, Bulgaria, Chile, Colombia, Egypt, Macau, Nigeria, Pakistan, Tunisia and the UAE. Countries such as Bangladesh, Kenya, Lebanon and Sri Lanka continue to face notable challenges.
Janata Bank from Bangladesh recorded the highest gross non-performing loan (NPL) ratio at 67.4% in FY2024, up from 25.4% in FY2023, largely due to widespread irregularities and major scams, followed by Rupali Bank and Agrani Bank at 41.5% and 40.5%, respectively. Sonali Bank also recorded a high gross NPL ratio of 17.8%. The loan loss reserves (LLRs) to gross NPLs ratio stood at 8.6% for Janata Bank, 8.5% for Rupali Bank, 22% for Agrani Bank and 83% for Sonali Bank.
BLOM Bank, Bank Audi and Bank of Beirut from Lebanon saw their weighted average NPL ratio decline from 24.9% in FY2023 to 21.1% in FY2024, though levels remain high. Byblos Bank, with an NPL ratio of 39.5% in FY2023, did not disclose FY2024 data.
Sri Lanka’s People’s Bank and Bank of Ceylon reported gross NPL ratios of 17.6% and 15.2%, while Kenya’s KCB Group and Equity Group Holdings recorded 20.9% and 12.3%, respectively, all showing an increase from the previous year
What does it mean to be in the Bank Watch List?
In this year’s ranking, we have identified gross NPL ratio (above 10%) and loan loss reserves to gross NPLs ratio (below 100%) as parameters that will impact financial strength due to fluctuations in macroeconomic and business conditions. The Bank Watch List is a tool to monitor and review parameters to give a holistic view of financial strength and the institutions being evaluated. This is the first iteration of what we think will be a powerful tool for the industry globally to benchmark and review financial strength; the list will be continuously enhanced.
For the complete ranking of the World's 1000 Strongest Banks visit
Download the Databook of the worlds Largest and Strongest banker here.

.png)
.png)


.png)
.webp)