
Canada’s Bank of Montreal, Bank of China (Hong Kong), and Saudi Arabia’s Al Rajhi Bank have secured the top three positions in the TAB Global 1000 World’s Strongest Banks 2023 ranking. This year represents a significant milestone as the ranking has expanded to include 1000 banks and financial holding companies from across the globe. It encompasses 1000 banks from 98 countries, territories, and special administrative regions, evaluating their performance for the financial year (FY) 2022, with a cutoff date in March 2023.
The list comprises 443 banks from Asia Pacific, 220 from Europe, 170 from North America, 69 from the Middle East, 48 from South America, 29 from Africa, 14 from Central America, and seven from the Caribbean region. Within the top 100 strongest banks in the world, there are 46 from Asia Pacific, 26 from Europe, 14 from the Middle East, 13 from North America, and one from South America.
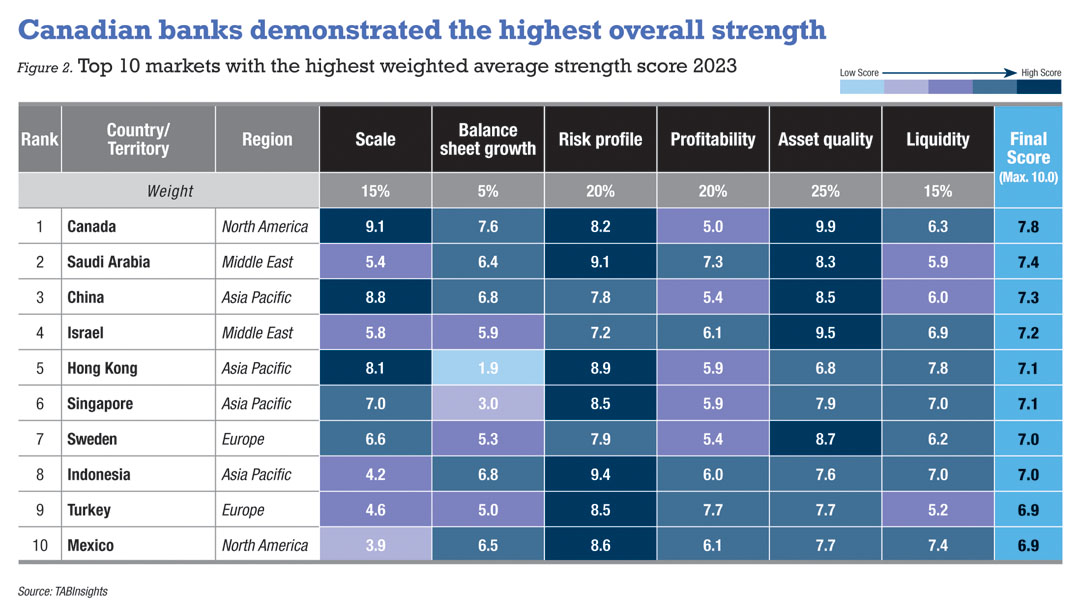
Notably, the strongest banks in Austria, Canada, China, Finland, Germany, Hong Kong, Indonesia, Israel, Italy, Malaysia, Mexico, Saudi Arabia, Singapore, and Sweden all secured positions among the top 30 strongest banks in the world.
Overall regional strength
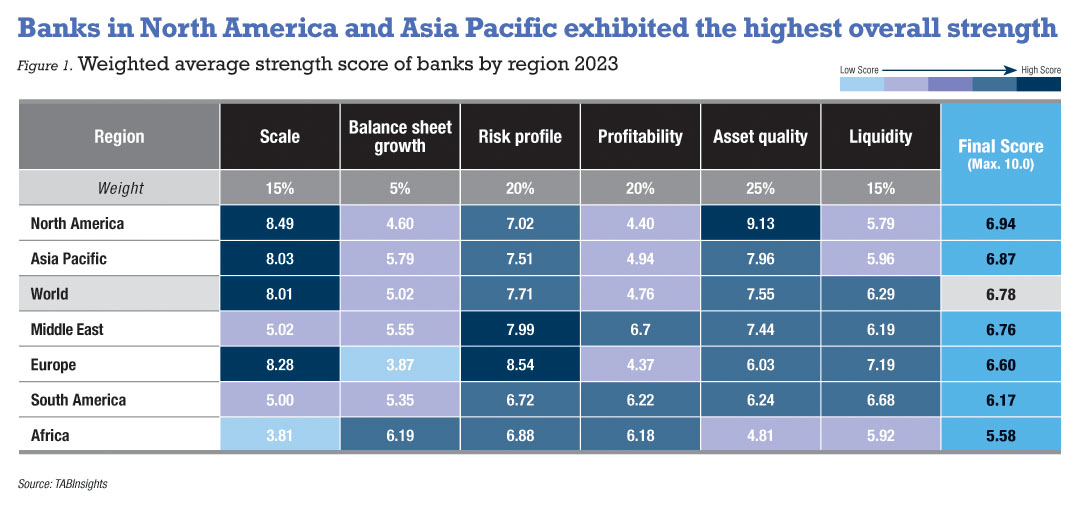
When assessing the overall strength of the banking sector, North America secured the highest weighted average strength score of 6.94 out of 10, closely followed by Asia Pacific at 6.87. Banks from regions outside North America and Asia Pacific scored below the global average, which was set at 6.78 for all 1000 banks. The Middle East achieved an average strength score of 6.76, Europe 6.6, South America 6.17, and Africa 5.58.
North America
In general, North American banks achieved superior scores in terms of scale and asset quality when compared to banks in other regions. Canadian banks displayed the highest level of strength in the world, with six of the largest Canadian banks holding positions among the top 30 strongest banks in the world. By contrast, JPMorgan, the strongest bank in the US, ranked 31st globally. Moreover, only four US banks—JPMorgan, Morgan Stanley, Bank of America, and Citigroup—managed to secure spots in the top 100 strongest banks in the world. The US banks received comparatively lower average scores in balance sheet growth, profitability, and liquidity.
Canada’s banking sector is characterised by high concentration, with six major banks controlling most assets, leading to effective oversight. These banks prioritise stability over risky ventures, relying on steady deposits for profits. Canadian banks operate under stringent regulations, including stricter capitalisation and underwriting standards, resulting in reduced exposure to risk compared to their US counterparts. Regulatory responsibilities are distributed between the Bank of Canada and the Office of the Superintendent of Financial Institutions, reinforcing a rigorous oversight framework. By contrast, the US banking landscape is more diversified, but regulatory authority is consolidated under the Federal Reserve, potentially introducing greater systemic risks.
The lessons gleaned from the Asian financial crisis highlighted the significance of maintaining strong capital and liquidity positions among Asian banks, especially in Hong Kong, Indonesia and Thailand. In the US—the origin of the global financial crisis—the state of prudential and systemic risk regulation remains less than desirable. The relaxation of liquidity rules and supervisory oversight of banks with less than $250 billion in assets was partly responsible for the collapse of a number of regional banks such as Silicon Valley Bank and Signature Bank that precipitated a liquidity crisis in the US. A global contagion was only averted by a timely regulatory response by the Swiss central bank when Credit Suisse showed signs of significant distress.
Asia Pacific
Asia Pacific banks demonstrated robust performance across most dimensions. Chinese banks obtained the highest average scores in Asia Pacific, followed by banks from Hong Kong, Singapore, and Indonesia. Chinese banks excelled in scale, balance sheet growth, and asset quality, while Hong Kong and Singapore banks outperformed in areas such as risk profile, profitability, and liquidity.
Four out of the top five strongest banks in Asia Pacific are from China. All three of Hong Kong’s largest banks secured positions within the top 100 strongest banks globally, while Singapore’s three largest banks, DBS, OCBC Bank, and UOB, achieved rankings of 22nd, 36th, and 179th, respectively.
Indonesian banks, despite their relatively lower average score in scale at 4.2, demonstrated an impressive average score of 9.5 in risk profile, the highest among all the countries or territories assessed in the ranking. Moreover, Indonesian banks exhibited robust performance in balance sheets, profitability, and liquidity. Bank Central Asia and Bank Mandiri secured the 16th and 26th positions, respectively, in the ranking of the world’s strongest banks.
Middle East
Middle Eastern banks outperformed banks in other regions in terms of profitability. They also demonstrated strong performance in risk profile despite their relatively smaller size. Saudi Arabian banks attained the highest average score in the Middle East, reaching 7.4, while Israeli banks followed closely with a score of 7.2.
The three largest banks in Saudi Arabia—Al Rajhi Bank, Riyad Bank, and Saudi National Bank—ranked among the top 30 strongest banks globally. Despite receiving relatively lower scores in scale at 5.4, Saudi Arabian banks excelled in other dimensions, especially risk profile, asset quality, and profitability. UAE banks outperformed Saudi Arabian banks in terms of profitability, but their average score in asset quality is lower.
Europe
Overall, European banks achieved higher average scores in risk profile and liquidity compared to banks in other regions. However, their average scores in balance sheet growth and profitability are lower. Swedish banks earned the highest average scores in Europe, with Turkey following closely behind. Skandinaviska Enskilda Banken and Swedbank, both based in Sweden, secured the ninth and 34th positions, respectively.
While banks from France, Germany, Italy, and the UK outperformed Swedish banks in terms of scale, risk profile, and liquidity, they lagged behind in balance sheet growth, profitability, and asset quality. The strongest banks in these countries—Commerzbank, UniCredit, Barclays, and Credit Agricole—achieved global rankings of 16th, 22nd, 33rd, and 42nd, respectively.
South America
South American banks showcased robust performance in profitability and liquidity but received the lowest score in risk profile among all regions. Brazilian banks attained the highest average score in in the region at 6.67. Banco do Brasil, the strongest bank in South America, placed 56th in the world and is the only South American bank that ranked among the top 100 globally.
Africa
Banks from Africa achieved the highest average score in balance sheet growth among all regions, but average scores in scale and asset quality lagged behind those of banks in other regions. South African banks attained the highest average scores in Africa, due to higher scores in scale and risk profile compared to banks in other countries. However, the strongest bank in Africa is from Nigeria—Zenith Bank placed 200th in the world. It exhibited stronger asset quality and a higher liquid assets-to-total deposits and borrowings ratio compared to South African banks.
Strongest banks in the world
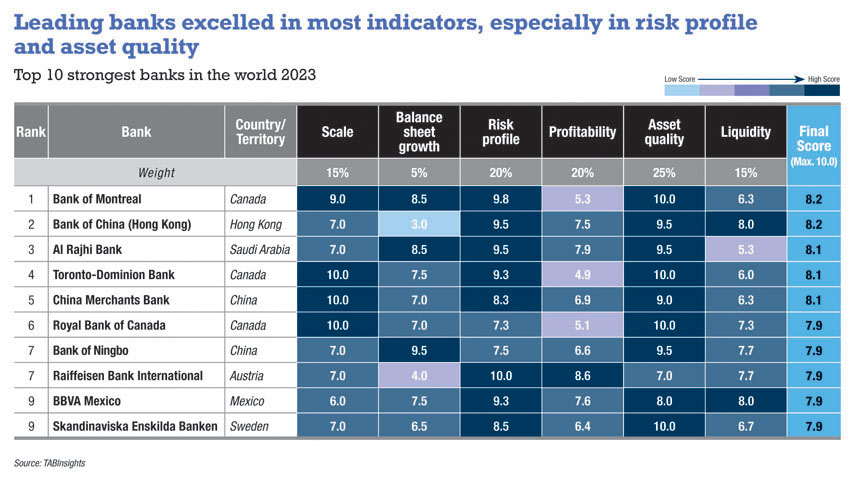
The top 10 strongest banks in the world include three Canadian banks, two Chinese banks, one each from Austria, Hong Kong, Mexico, Saudi Arabia and Sweden. These banks have excelled in various dimensions, with a strong focus on scale, risk profile, and asset quality.
Bank of Montreal secured the top position worldwide with a final score of 8.2, demonstrating excellence in various key areas such as scale, balance sheet growth, risk profile, and asset quality. The bank’s commitment to prudent risk management is evident through its low gross non-performing loan (NPL) ratio of 0.4% and a robust loan loss reserves-to-gross-NPL ratio of 131% in 2022.
Meanwhile, the bank achieved notable growth, with a 20.3% increase in net loans and a 12.1% rise in customer deposits. It maintains a strong capital position, with a Tier 1 capital ratio of 18.4% and a total capital adequacy ratio (CAR) of 20.7%. Nevertheless, its profitability slightly lags behind that of Bank of China (Hong Kong) and Al Rajhi Bank, despite an improvement in its return on assets (ROA) from 0.8% in 2021 to 1.3% in 2022. In February 2023, the bank completed its $16.3 billion acquisition of San Francisco-based Bank of the West, expanding its reach into western US.
Bank of China (Hong Kong) follows closely, leveraging its strengths in risk profile, asset quality, and liquidity to secure the second spot. The bank displayed a robust capital and liquidity position, with Tier 1 capital ratio and total CAR reaching 19.3% and 21.6% in 2022, respectively. Demonstrating solid liquidity management, it maintained a liquid assets-to-total deposits and borrowings ratio of 47%, coupled with an LCR of 178% and an NSFR of 132%. Its balance sheet growth was relatively subdued, with net loan growth slowing from 6.5% in 2021 to 3.1% in 2022, a reflection of diminished loan demand amid uncertain economic conditions. Nevertheless, the bank has consistently maintained strong profitability, evidenced by its cost-to-income ratio (CIR) improving from 33.6% in 2021 to 28.6% in 2022.
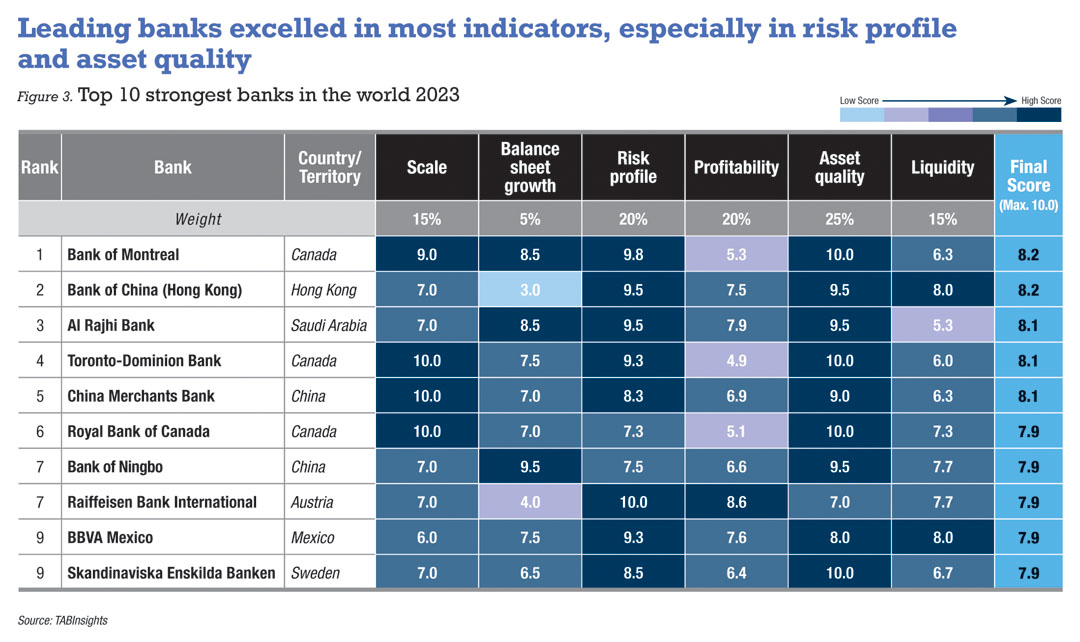
Al Rajhi Bank takes the third position, excelling in balance sheet growth, risk profile, and profitability. The bank recorded a 25.5% growth in net financing and a 10.3% increase in customer deposits. It maintained strong profitability metrics, including a low CIR of 26% and a notable ROA of 2.45%. Additionally, the bank upheld a robust capital position, boasting a CAR of 21.4%. However, in terms of liquidity, it falls behind Bank of Montreal and Bank of China (Hong Kong), with a liquid assets-to-total deposits and borrowings ratio standing at 15.5%, alongside an LCR of 126% and an NSFR of 110%, respectively.
Other banks within the top 10 strongest worldwide include Toronto-Dominion Bank, China Merchants Bank, Royal Bank of Canada, Raiffeisen Bank International, Bank of Ningbo, BBVA Mexico, and Skandinaviska Enskilda Banken. Toronto-Dominion Bank, Royal Bank of Canada, and Skandinaviska Enskilda Banken exhibited robust asset quality, whereas BBVA Mexico, Raiffeisen Bank International, and Bank of Ningbo demonstrated robust liquidity. Compared to the four largest banks in China, China Merchants Bank outperformed with a higher ROA, a lower gross NPL ratio, and stronger liquidity.
Profitability
.jpg)
The 1000 banks featured in the ranking reported an average ROA of 0.74% in FY2022, a slight dip from the 0.76% recorded by these banks in FY2021. The countries that experienced the most significant drops in average ROA included Hungary, the US, Denmark, Nigeria, the Netherlands, and Pakistan. The US banks saw their ROA decrease from 1.21% in FY2021 to 0.92% in FY2022, with half of them reporting reduced net profit.
Turkey led with the highest average ROA, followed by Argentina, Indonesia, and Peru, all of which showcased notable improvements in ROA. Turkish banks, driven by robust loan growth amid high inflation and enhanced net interest margins, saw their ROA surge from 1.3% in FY2021 to 3.7% in FY2022.
Indonesian banks also showed improvement, with their average ROA increasing from 1.75% in FY2021 to 2.32% in FY2022. By contrast, several countries, including Denmark, Japan, France, Bangladesh, Germany, the Netherlands, the UK, and Ireland, reported average ROA below 0.5%.
The average CIR of the 1000 banks stood at 51.8% in FY2022, a slight decrease from the 52.1% recorded by these banks in FY2021. Countries that witnessed the most significant improvements in average CIR included Austria, Turkey, Israel, Portugal, and the UK, while countries like Japan, Hungary, and China saw an increase in CIR. Despite an increase in CIR from 32.5% in FY2021 to 34.3% in FY2022, Chinese banks maintained high cost efficiency. Meanwhile, Qatari banks boasted the lowest CIR, followed by Turkey, the UAE, and Saudi Arabia.
Asset quality
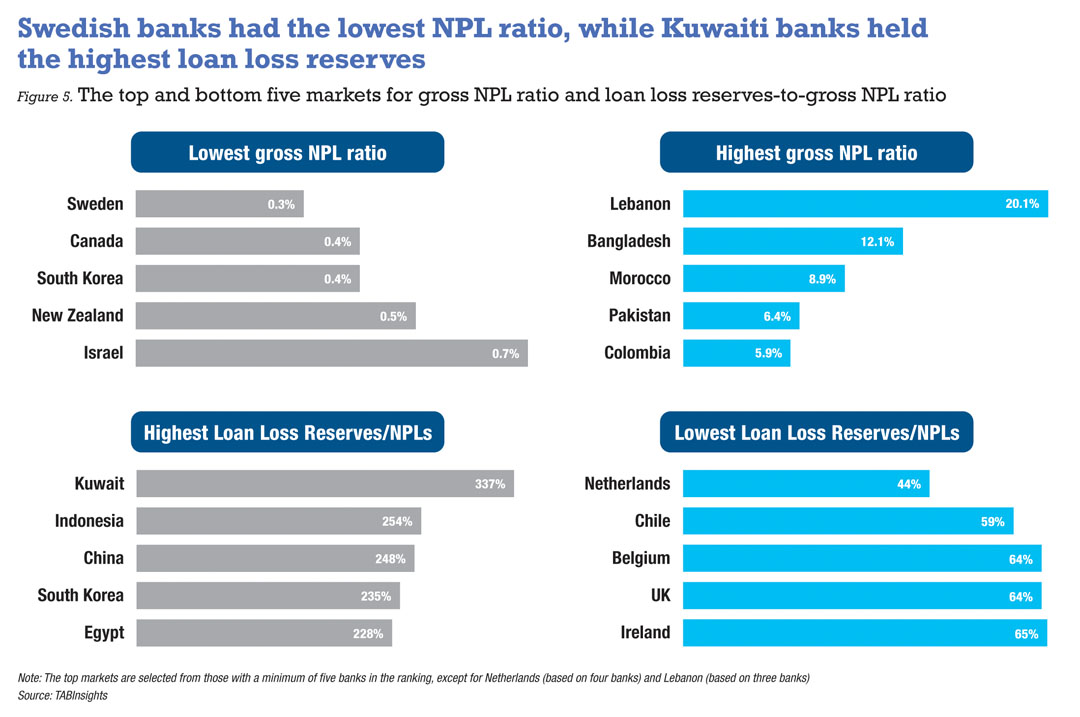
The overall asset quality of the banking industry improved in FY2022, evident in the decline of the weighted average gross NPL ratio from 1.8% in FY2021 to 1.65% in FY2022. Additionally, the average ratio of loan loss reserves-to-gross NPL increased from 147% in FY2021 to 155% in FY2022.
Banks in Argentina, India, Colombia, Ireland, and the Philippines experienced the most significant enhancements in their gross NPL ratios. On the other hand, banks in Turkey, the US, Argentina, New Zealand, South Korea, and Indonesia saw the most substantial increases in their loan loss reserves-to-gross NPL ratio. Banks in markets such as Brazil, Qatar, Hong Kong, Chile, and Egypt recorded higher gross NPL ratios in FY2022. Additionally, banks in Brazil, Hong Kong, Malaysia, Saudi Arabia, and Vietnam reported a decrease in their average loan loss reserves-to-gross NPL ratio.
On average, Canada, South Korea, Israel, Taiwan and the US are the markets that received the highest average score in asset quality. Banks in Sweden, Canada and South Korea boasted the lowest gross NPL ratios, standing at 0.26%, 0.37% and 0.4%, respectively. Banks in Kuwait, Indonesia and China maintained the highest ratios of loan loss reserves-to-gross NPL at 337%, 254% and 248%, respectively.
Capitalisation and liquidity
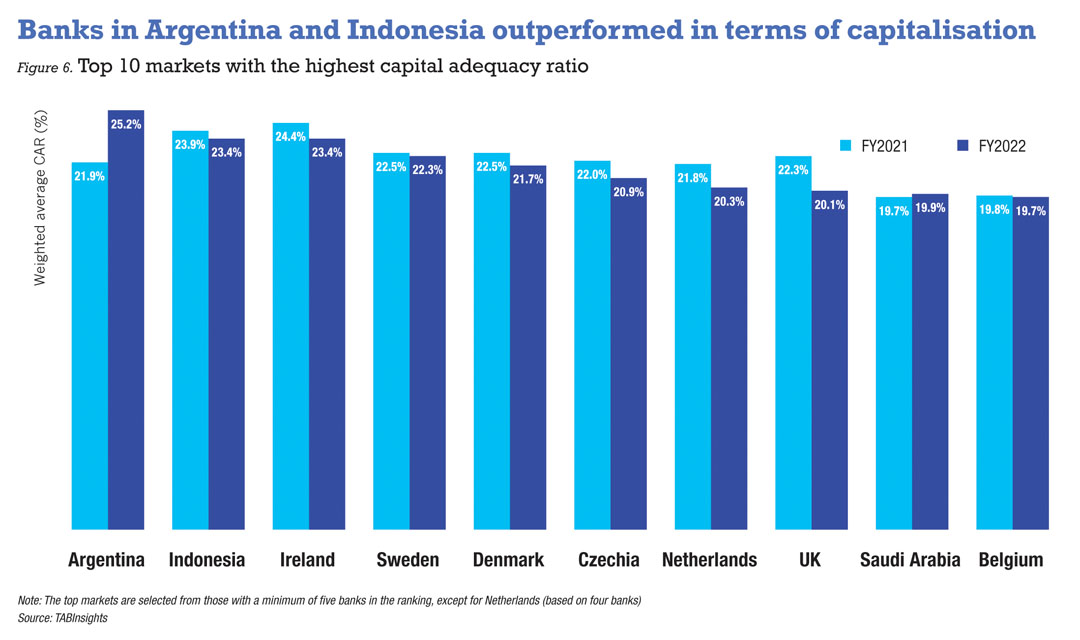
While FY2022 witnessed a decline in the average CAR in several markets, most markets maintained a stable level of capitalisation. Argentina’s banks achieved the highest average CAR in the world in FY2022, reaching 25.2%, up from 21.9% in FY2021. Indonesian banks closely followed with the second-highest average CAR at 23.4%, despite a slight dip in FY2021.
Conversely, banks in Bangladesh, Vietnam, Morocco, Colombia and Israel underperformed in terms of capitalisation. The average CAR of Bangladeshi banks was only 10.6%, down from 11.1% in the previous year. Vietnamese banks continued to grapple with relatively low CAR despite some marginal improvement. Egypt, the UK, Netherlands, Colombia, the Philippines, Nigeria, and Kuwait witnessed notable CAR declines, with Egyptian banks falling from 21.8% to 17.2%, UK banks from 22.3% to 20.1%, and Netherlands banks from 21.8% to 20.3%.
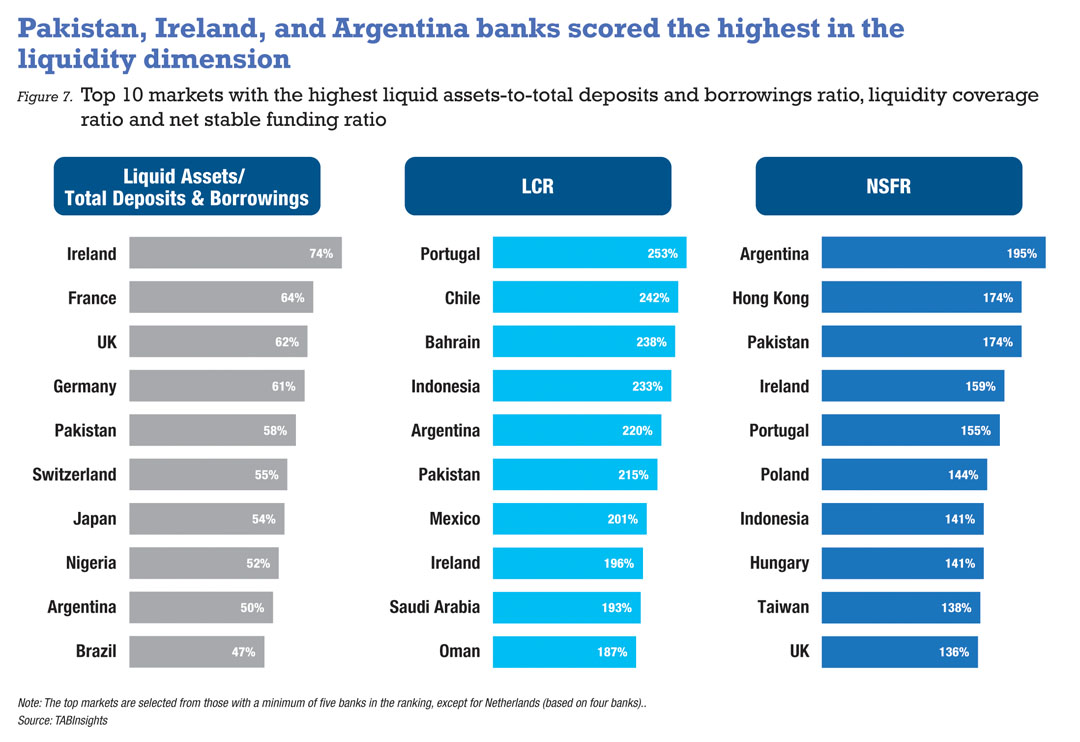
Pakistan secured the top position in the liquidity dimension, assessed through three key indicators: the liquid assets-to-total deposits and borrowings ratio, LCR, and NSFR. Following closely were Ireland, Argentina, the UK, and Hong Kong. Notably, Pakistan’s banks recorded an average liquid assets-to-total deposits and borrowings ratio of 58%, alongside strong average LCR and NSFR metrics of 215% and 174%, respectively.
The average liquid assets-to-total deposits and borrowings ratio of 1000 banks dropped slightly from 41% in FY2021 to 39% in FY2022. Several countries posted reduced average liquid assets-to-total deposits and borrowings ratios, including Egypt, the US, Portugal, the Philippines, and Italy. Additionally, banks in the ranking experienced an uptick in their average loan-to-deposit ratio, rising from 80.5% in FY2021 to 81.6% in FY2022, while their average equity-to-assets ratio dropped from 7.46% to 7.35%.
An increasing number of banks will disclose their LCR and NSFR figures in 2023. This development is set to provide valuable insights into banks’ liquidity risk profiles and enhance overall transparency in this regard.
The TAB Global 1000 World’s Strongest Banks ranking evaluates the 1000 largest banks in the world based on their strength. This ranking employs a detailed and transparent scorecard to assess banks using six criteria related to balance sheet performance: scale, balance sheet growth, risk profile, profitability, asset quality, and liquidity, encompassing 14 specific factors. In this year’s assessment, two new factors have been incorporated: the liquidity coverage ratio (LCR) and net stable funding ratio (NSFR). These two financial metrics gauge a bank’s ability to meet short-term and long-term liquidity requirements, respectively.
Click here to know more about The World's Strongest Bank criteria
Click here to view the full ranking of the World's Strongest Bank
.png)
.png)


.png)
.webp)